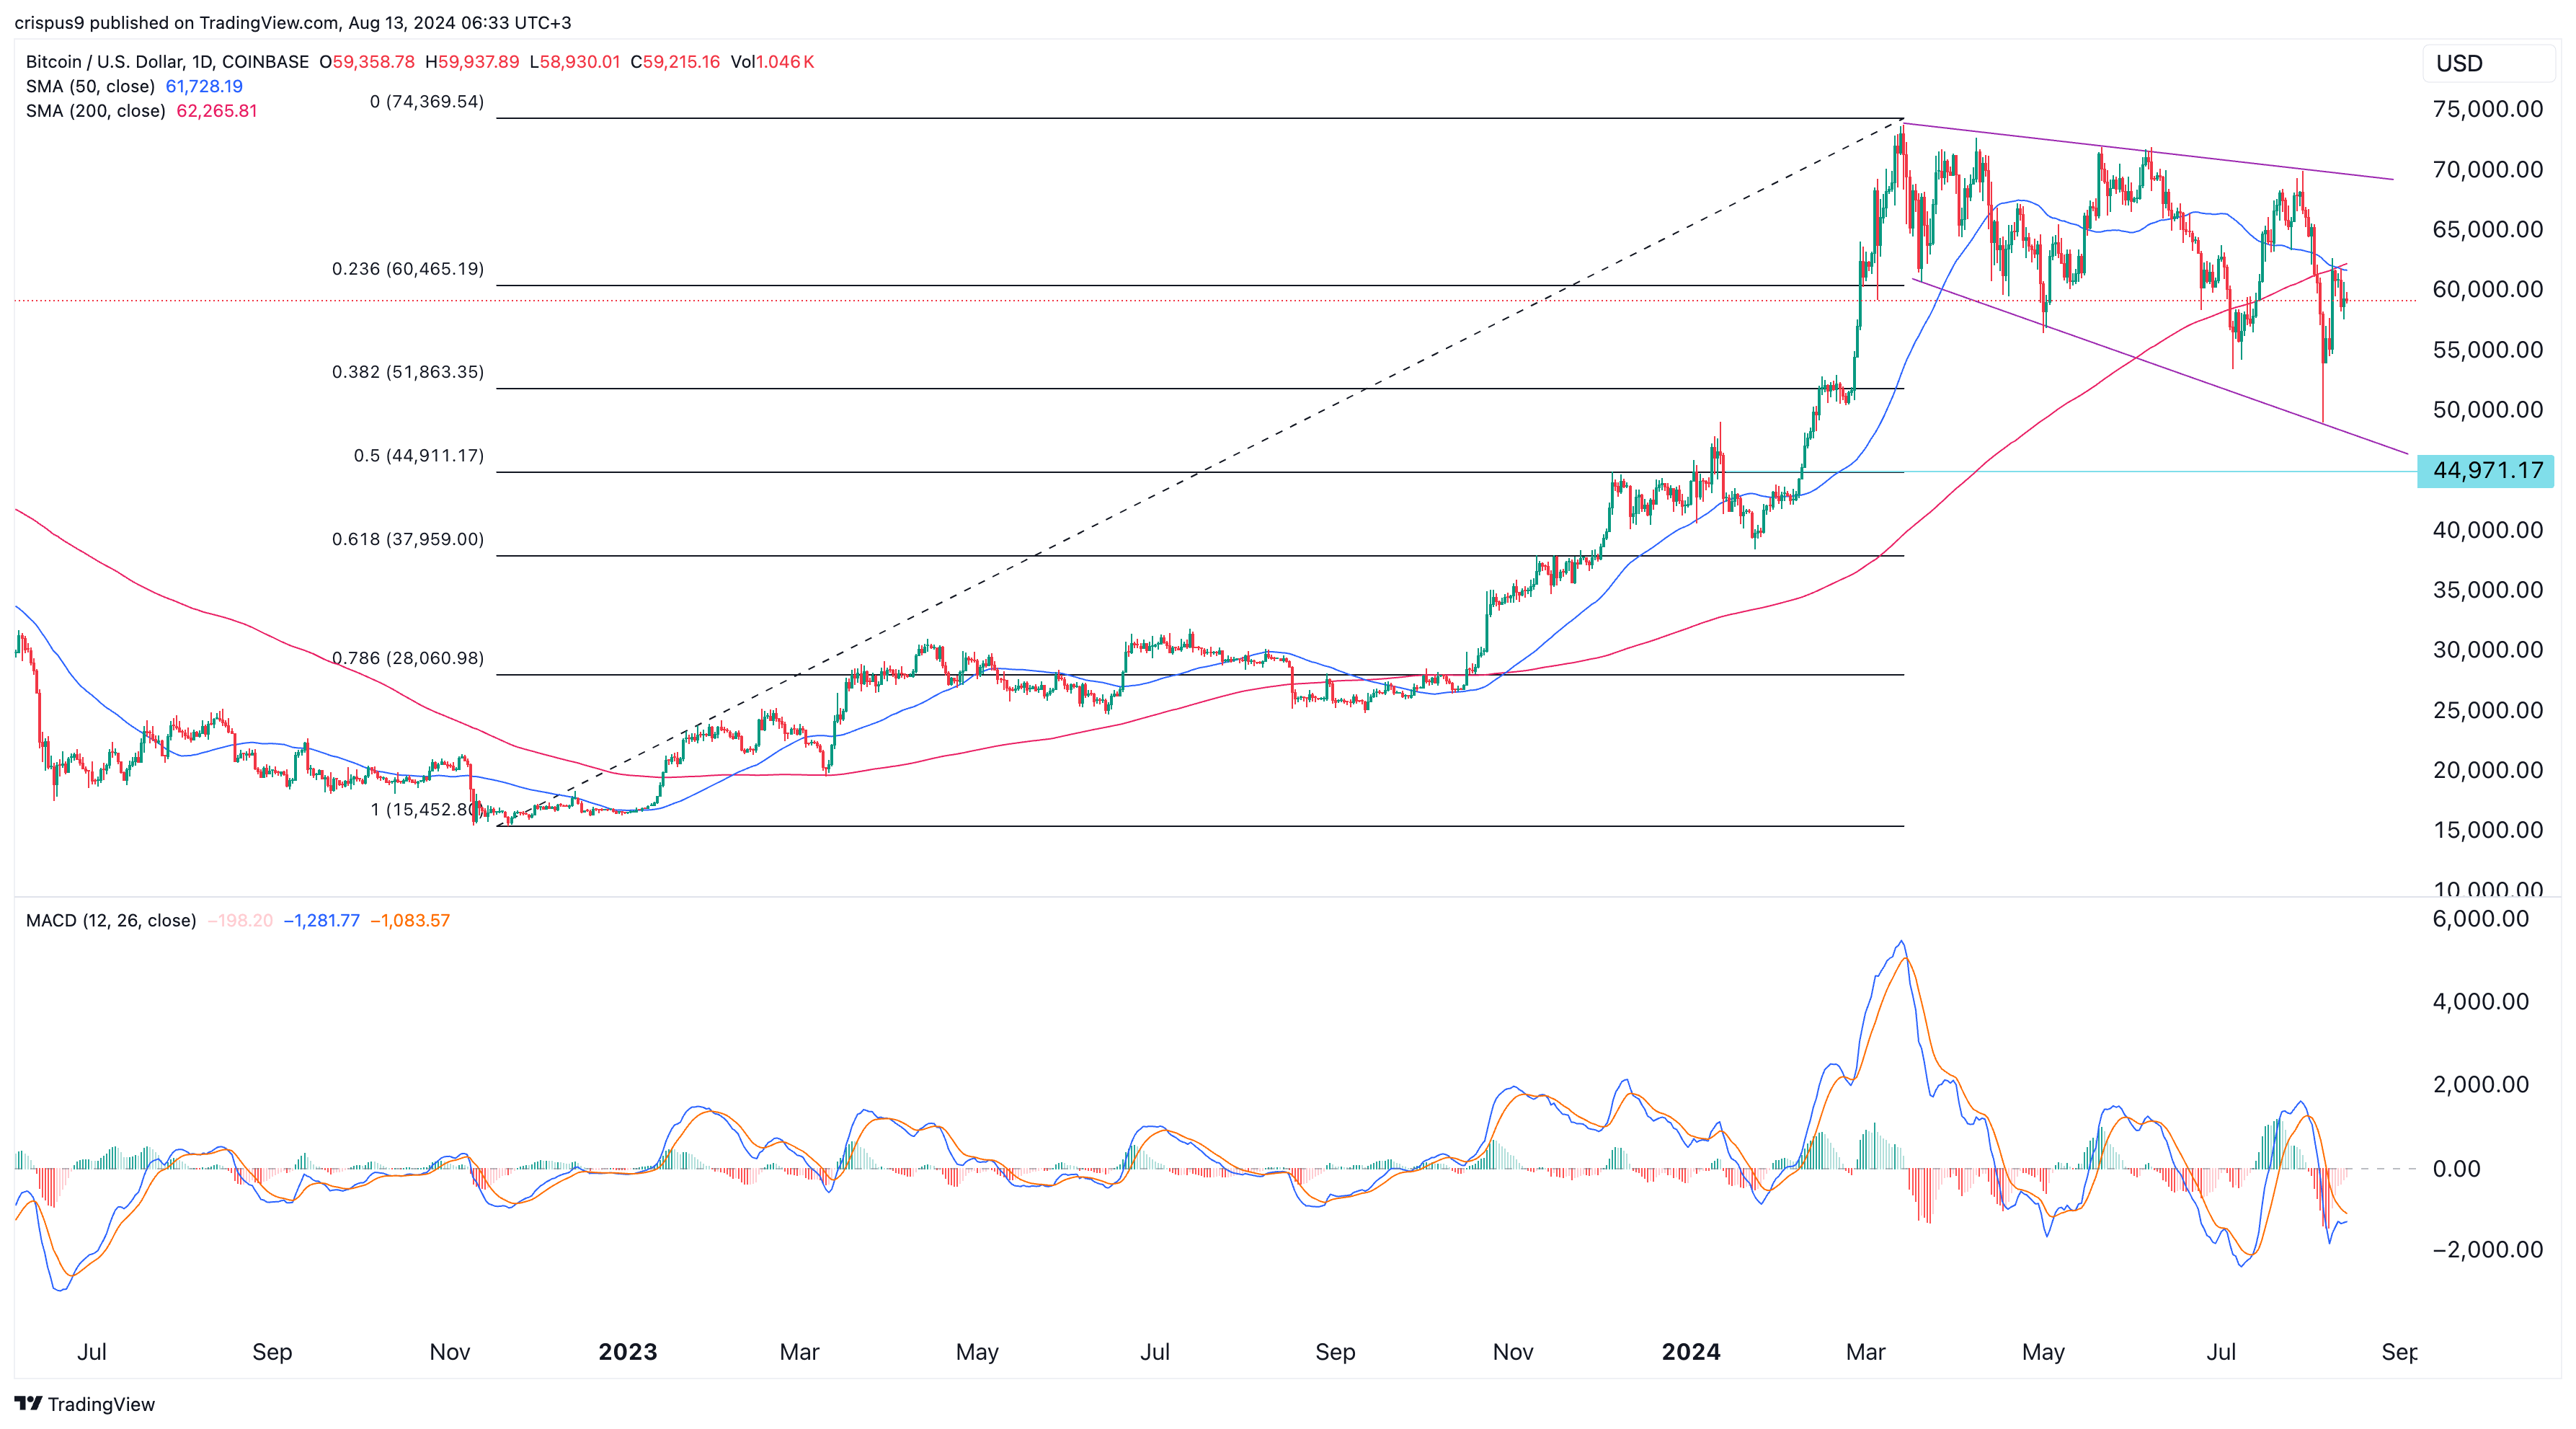
The Bitcoin price is sending mixed signals, with bulls and bears divided on what to expect in the coming months. On Tuesday, BTC was trading at $59,152, up from last week’s low of $49,000.
Bitcoin price technicals vs fundamentals
Fundamentally, Bitcoin still has more room to run as spot Exchange-Traded Funds (ETFs) are seeing more inflows. The coin could also benefit from the Sahm Rule, which predicts a recession in the coming months.
The Sahm Rule does this by examining the labor market and the unemployment rate. When the index rises above 0.50%, which it did recently, the odds of a recession rise. A recession would be good for Bitcoin and other assets because it would make the Fed more open to aggressive interest rate cuts.
Technically, Bitcoin is sending mixed signals as well. It has formed a falling broadening wedge pattern, a popular bullish sign. Also, the two lines of the MACD are about to form a bullish crossover.
However, it has also formed a death cross as the 50-day and 200-day Simple Moving Averages (EMA) have crossed each other. In most cases, this cross leads to a substantial sell-off in the market.

On the positive side, the exponential moving averages have yet to form the death cross. The EMA is seen as a better indicator than the EMA because it emphasizes recent data.
On the other hand, analysts are generally bullish on Bitcoin, with some, like MicroStrategy’s Michael Saylor, predicting that it will jump to over $13 million in the long term. Ki Young Ju, the founder of CryptoQuant believes that Bitcoin is in an accumulation phase, especially now that Russia has signed a bill to legalize cryptocurrencies.
Bitcoin is also wavering as investors watch the US political season. Recent Polymarket data shows that Kamala Harris was beating Donald Trump, a move seen as negative since the latter has highly supported the industry. However, these fears are overblown as Bitcoin has always hit a record high in Democratic and Republican administrations.
Key BTC levels to watch
Therefore, Bitcoin’s price rebound will only be confirmed if it rises above the three key lower highs: $73,800 (March), $72,000 (June), and $70,000 (July). A move above these levels will confirm the bullish view of the falling broadening wedge pattern.
The potential catalyst that will push it higher is the sign that the Fed is willing to deliver more aggressive rate cuts. This, coupled with ETF inflows, will point to more gains in the coming months.
On the other hand, a drop below this month’s low at $49,000 will indicate more downside. The next point to watch is $44,970, the 50% Fibonacci Retracement point. Such a move would mean a 24% drop from the current level.


