


Bitcoin mining stocks may be ripe for a bullish breakout as BTC formed two important bullish patterns and as recession odds rose. CleanSpark (CLSK) stock price closed on Monday at $12.20, higher than the intraday low of $9.36, its lowest point since February 4th. It remains in a deep bear market, slipping by over 50% from its highest point this year.
Marathon Digital (MARA) stock rose to $16.95, up from Monday’s low of $13.73, while Core Scientific (CORZ) recovered to $8.37. Other top Bitcoin mining stocks, such as Cipher Mining (CIFR), TeraWulf, Hut 8 Mining (HUT), and Riot Blockchain (RIOT), also bounced back.
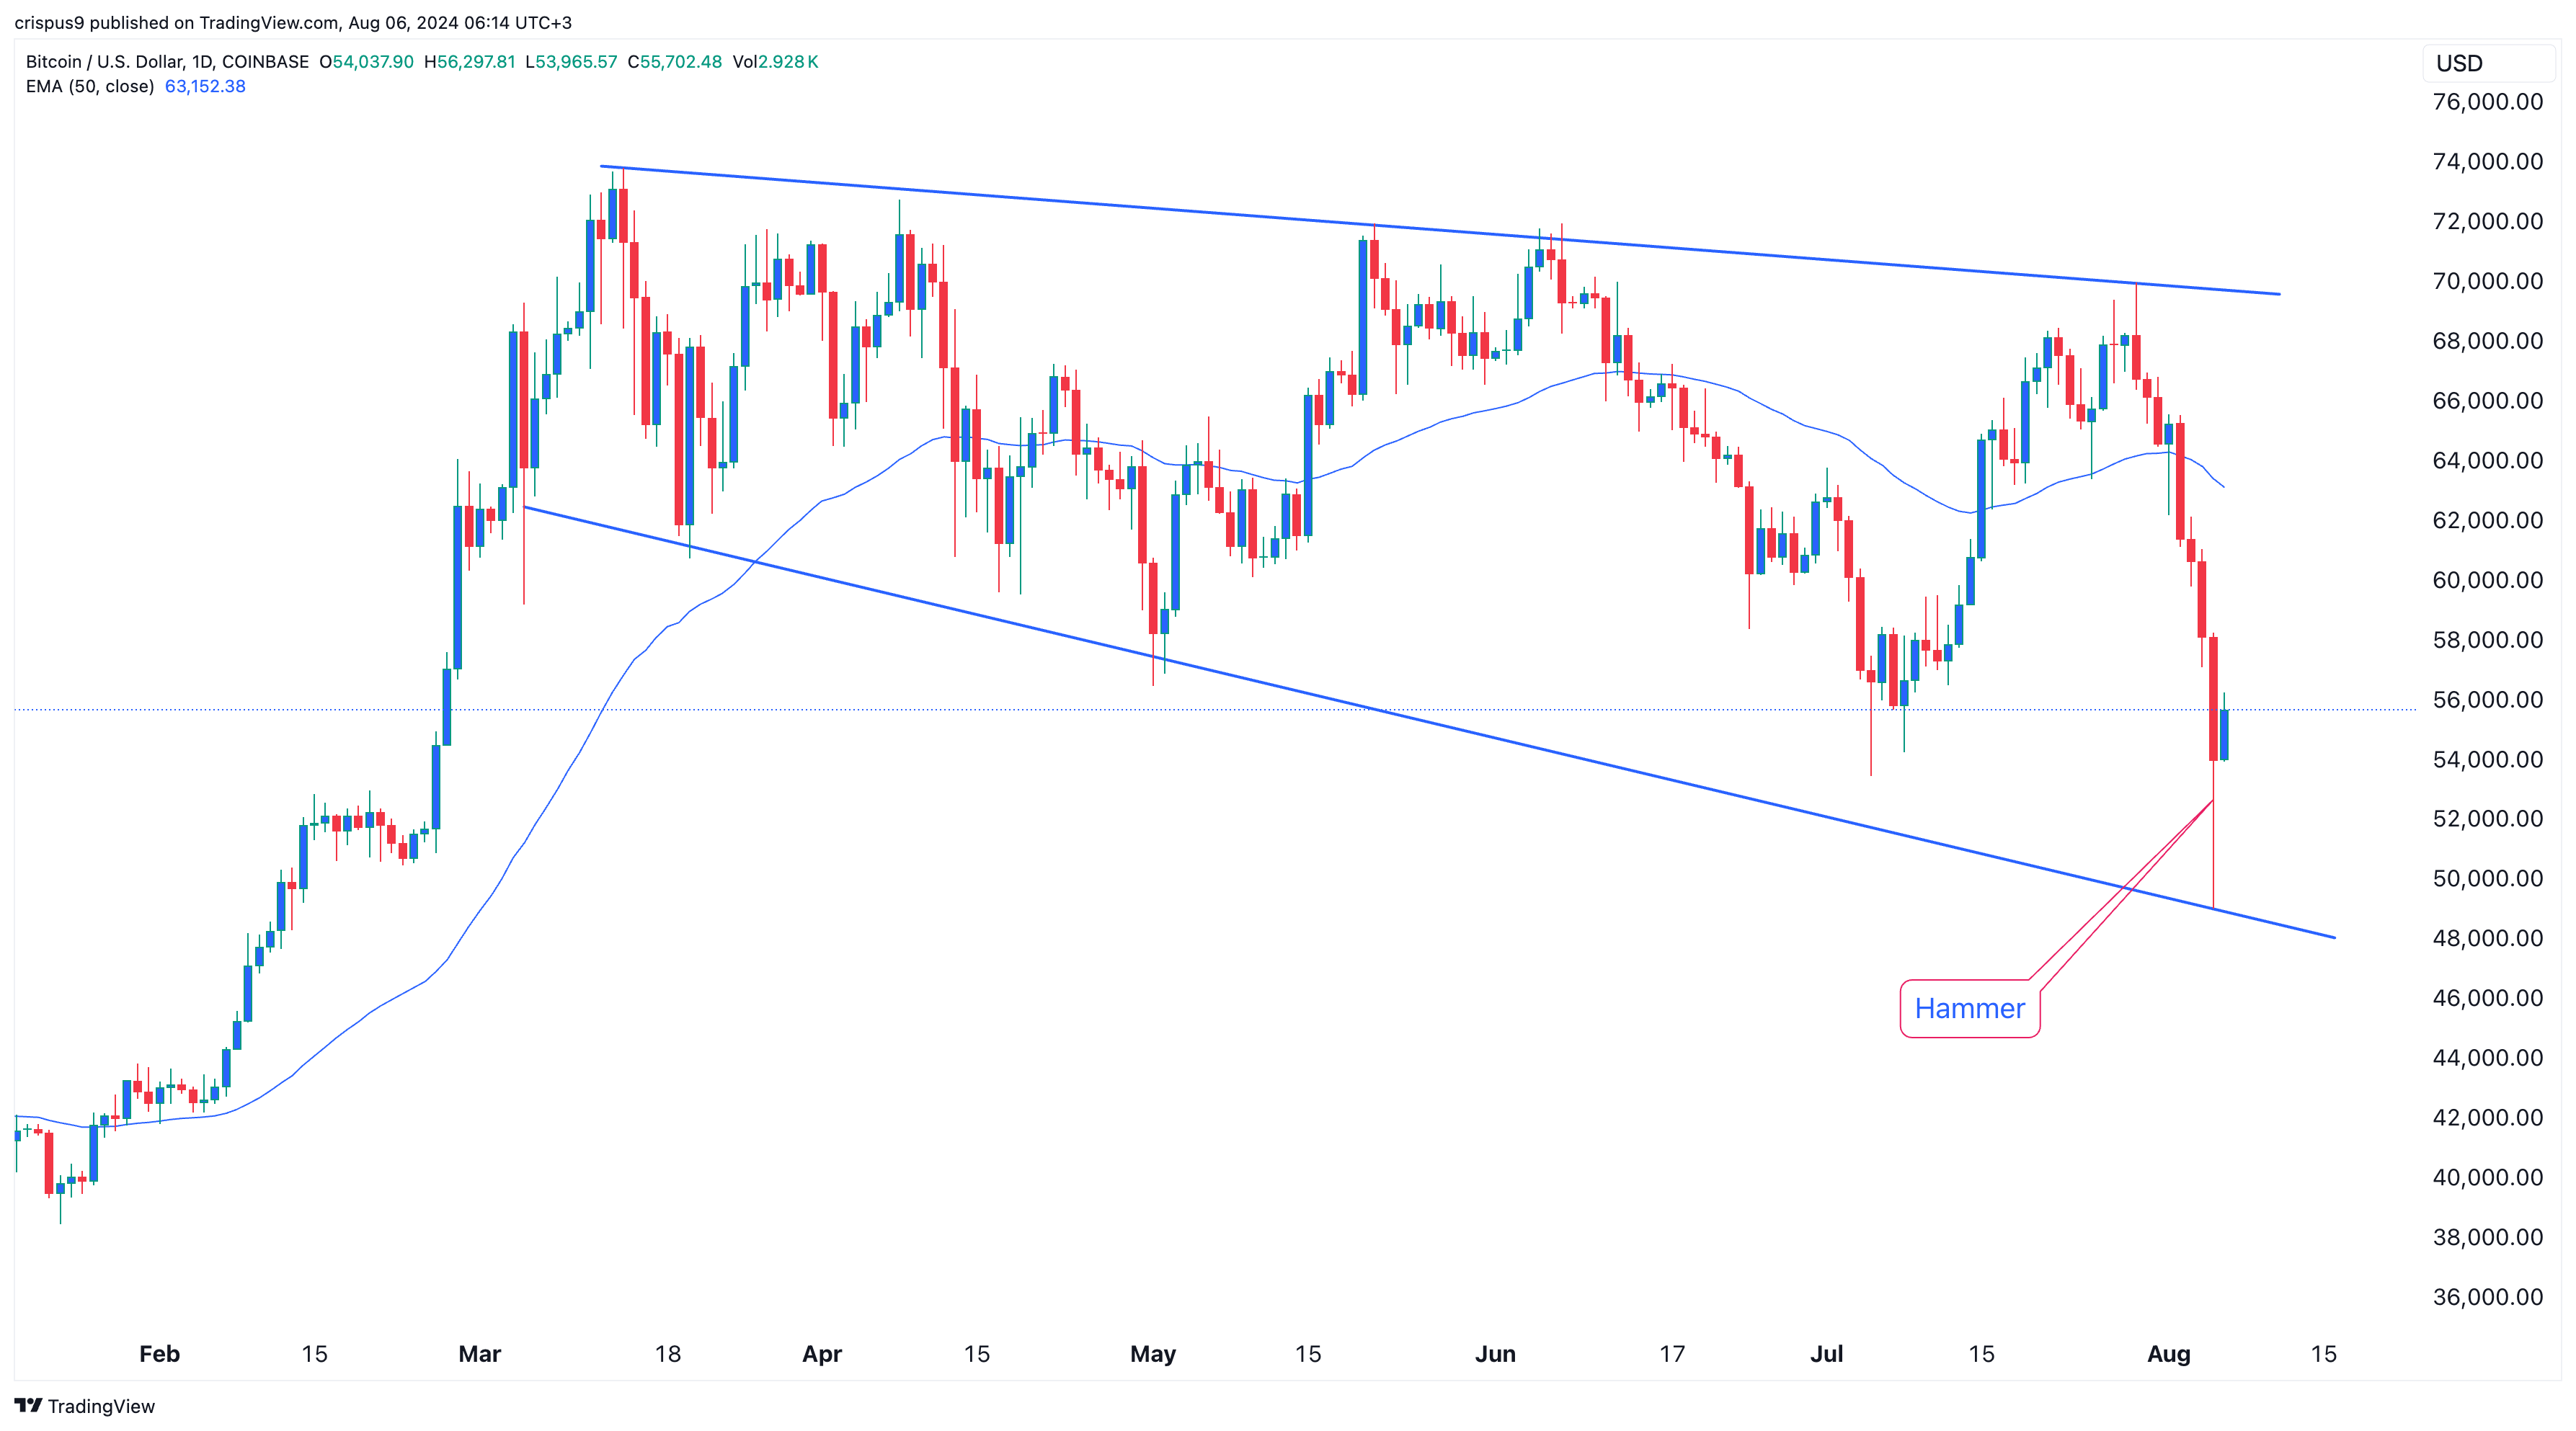
Bitcoin price has formed a hammer
Bitcoin mining stocks like CleanSpark, Marathon Digital, and Core Scientific rose because BTC showed signs of bottoming. It has also formed two bullish chart patterns that could push it higher this year.
The daily chart above shows that the BTC price has formed a hammer pattern, characterized by a body with a long lower shadow. A hammer does not usually have an upper wick and is one of the most popular bullish reversal candlesticks.
A bullish breakout in a hammer is confirmed when an asset rises above its upper side. It is then invalidated when the price drops below its lower side. Therefore, this hammer pattern points to more upside as buyers target the key resistance at $60,000.
Bitcoin’s broadening wedge but risks remain
Bitcoin has also formed a falling broadening wedge, which consists of two trendlines. The upper line consists of a series of lower highs, while the lower support line consists of lower lows. This pattern is shown in blue in the chart below. In most cases, it leads to a strong bullish breakout.
Fundamentally, Bitcoin has another catalyst from the Federal Reserve, which is expected to start cutting interest rates in September. Some analysts even recommend a jumbo rate cut of 0.50% or 0.75%. Fed cuts are often good for Bitcoin and other risky assets.
Still, Bitcoin has more work to do to confirm a bullish breakout. For one, it needs to invalidate that this rebound is just a dead cat bounce, which is a temporary rebound. It initially needs to rise above the 50-day moving average at $64,000 to do this.
If Bitcoin’s recovery holds, Bitcoin mining stocks like MARA, CLSK, and Core Scientific will likely continue rising on Tuesday.


