


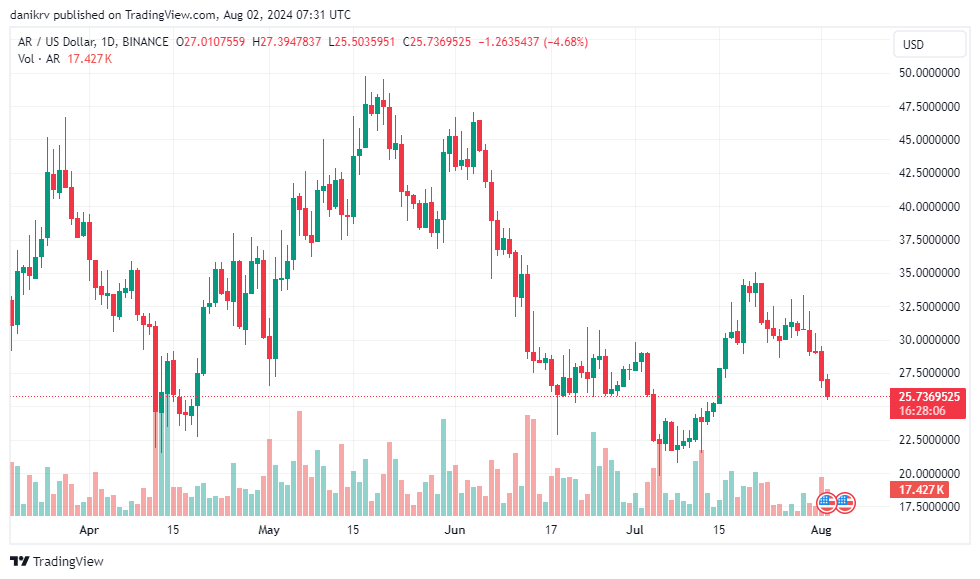
AR, the Arweave token, is down 11% today, trading for $25.70 per CoinGecko data. It rapidly reverses recent gains, and technical indicators suggest a strong sell. Here’s what you need to know.
Arweave reached an all-time high of $89.24 on November 5, 2021. The current price is 70.91% lower than the all-time high.
The token saw support at $30 after niche platforms reported that Irys had launched its Layer 1 programmatic datachain. The system integrates data storage and execution into a cohesive platform, addressing current blockchain challenges. Irys was founded in 2021 as Bundlr Network and focused on long-term storage solutions on Arweave.
Arweave price prediction
Arweave’s token has been declining since that support level. Moving averages and oscillators suggest a strong sell. The 50-day exponential moving average (EMA) is 29.7, compared to a 200-day EMA of 27.5. The higher 50-day average shows that recent price trends are more robust than the longer-term average.
However, the MACD value is −0.0042761, indicating that the shorter-term average (12-period EMA) is below the longer-term average (26-period EMA). This can suggest that Arweave is experiencing bearish momentum or that recent prices are weaker than the longer-term trend.
The magnitude of −0.0042761 is relatively small, indicating that the difference between the 12-period and 26-period EMAs is not substantial. This could imply a mild bearish momentum or a period of consolidation.
The Momentum (10) value is −4.8829821. Negative values indicate that the current price is lower than the price ten periods ago – by 4.8829821 units. The larger the negative value, the stronger the downward momentum.
This negative momentum value suggests a bearish trend or selling pressure over the last ten periods. It indicates that the asset’s price has been decreasing. The specific number shows relatively strong negative momentum.
Where will AR token find support?
The Fibonacci S1 level at 22.1304250 represents a potential support level where the price might find buying interest and potentially reverse or consolidate if it reaches this level.
If the price approaches this level, it might encounter buying pressure, making it a significant level to watch for potential reversals or bounces.
The current price of $25.70 is above the Fibonacci S1 level of 22.1304250. This suggests that if the price were to decline, $22.1304250 could be a support level where buyers might step in.