- Bitcoin price has formed a cup and handle pattern on the weekly chart.
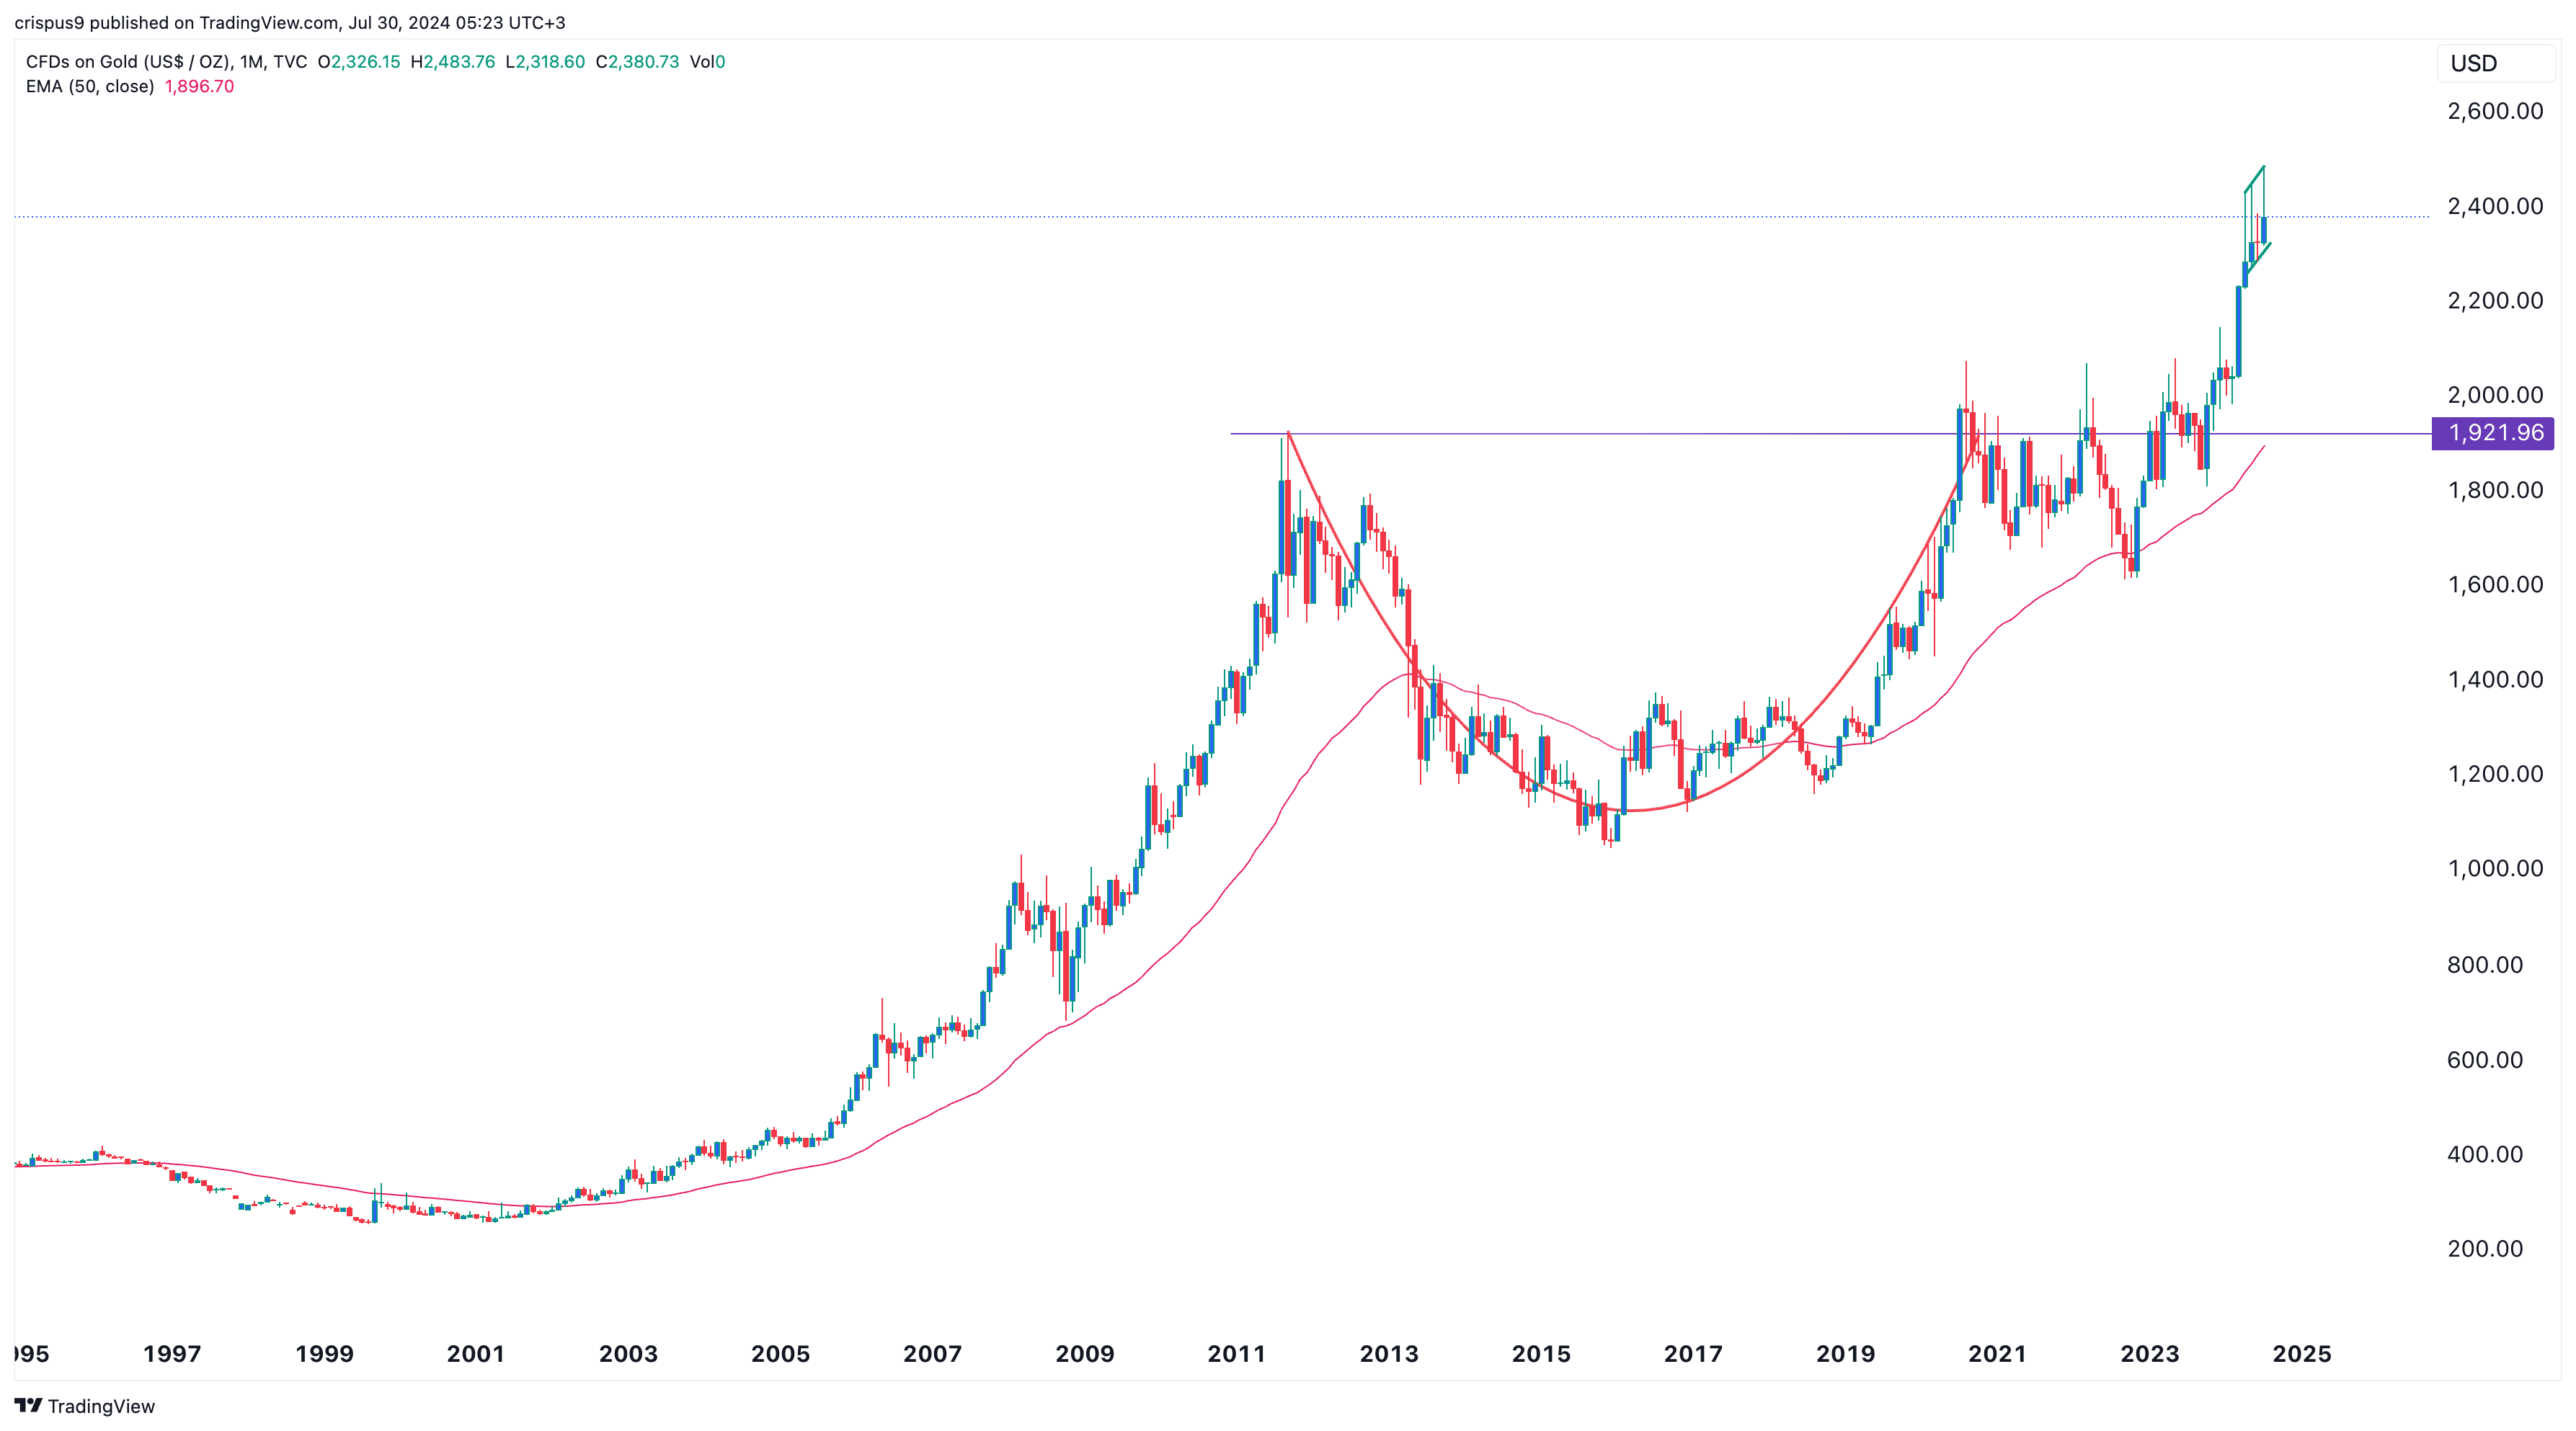
- Gold formed a similar pattern on the monthly chart before its breakout,
- Crypto stocks will benefit if Bitcoin makes a solid bullish breakout.
Crypto stocks have done well this year, most beating the broader market. Coinbase (COIN) stock has risen by over 34% as cryptocurrency prices soared, and it has become the market leader in the crypto custody industry.
Crypto stocks to benefit as BTC rallies
Bitcoin mining stocks like Core Scientific (CORZ), Riot Platforms (RIOT), Bitfarms (BITF), and Marathon Digital (MARA) have also risen this year. These companies do well when Bitcoin is rising because they are some of its biggest holdings. Data shows that Marathon Digital holds over 20,000 coins, while Riot and Hut 8 Mining have slightly under 10,000 coins.
This year, The best-performing Bitcoin stock has been MicroStrategy (MSTR), which holds over 226,000 coins. Its stock has soared by over 166%, giving it a market cap of over $30 billion compared to its Bitcoin holdings valued at less than $16 billion. MSTR has become a better holding than spot ETFs.
These crypto stocks have more catalysts that could push them higher for longer in the longer term.
First, Bitcoin demand and supply are moving in different directions. Demand is rising from the likes of ETFs while supply is slowing because of halving. There are signs that this demand will continue rising now that Trump has hinted that the government will accumulate and store Bitcoin as a reserve asset. Such a move will push more countries to do the same.
Second, analysts are upbeat on the price of Bitcoin. Michael Saylor noted that Bitcoin price could surge to over $49 million in the next 21 years. Larry Fink, Blackrock’s CEO, has become a Bitcoin believer, while VanEck believes the coin could vault to $52 million by 2050. Jen VanEck has allocated 30% of his net worth to Bitcoin.
Bitcoin price C&H pattern

BTC price chart by TradingView
Third, Bitcoin has formed an extremely bullish cup and handle pattern on the weekly chart. In most cases, this pattern usually leads to a big breakout over time. As shown above, the cup section is in red, while the recent consolidation is part of the handle section.
This pattern has been supported by the 50-day Exponential Moving Average (EMA), where Bitcoin failed to move below in July.
At the same time, the handle section also has a falling broadening wedge chart pattern, which is another bullish sign. Therefore, ultimately, if this pattern works well, there is a chance that it will have a bullish breakout.
Gold price C&H pattern

Gold price chart: Source: TradingView
A good example of the cup and handle pattern is looking at gold’s monthly chart. As shown above, gold formed a cup section between September 2011 and July 2020. It then formed the handle part between August 2020 and October 2023. Most recently, it has formed a bullish breakout, pushing it to a record high of nearly $2,500.
Looking ahead, most of these crypto stocks will be impacted by the upcoming earnings that start on Tuesday. Some of the companies to watch this week will be Coinbase, MicroStrategy, Riot Platforms, and Marathon Digital.


