


Pepe price has crawled back during the weekend as a sense of calm spread in the crypto market. After bottoming at $0.000007650 on July 5th, the token rose by over 27% and hit $0.00001 on Monday morning.
Pepe’s rebound coincided with the crypto comeback and the crypto fear and greed index movement. Bitcoin rose to $63,000 on Monday morning, while the total crypto market cap jumped to over $2.26 trillion. Other tokens like Jasmy and Stellar Lumens also showed a strong bullish trend.
Still, Pepe remains in a deep bear market, having fallen by more than 44% from its highest point this year. It also remains below the 50-day moving average, meaning that bears are still in control.
Despite this, BanklessTimes believes that a contrarian case can be made, especially when using technical analysis.
RSI falling wedge and three drives pattern
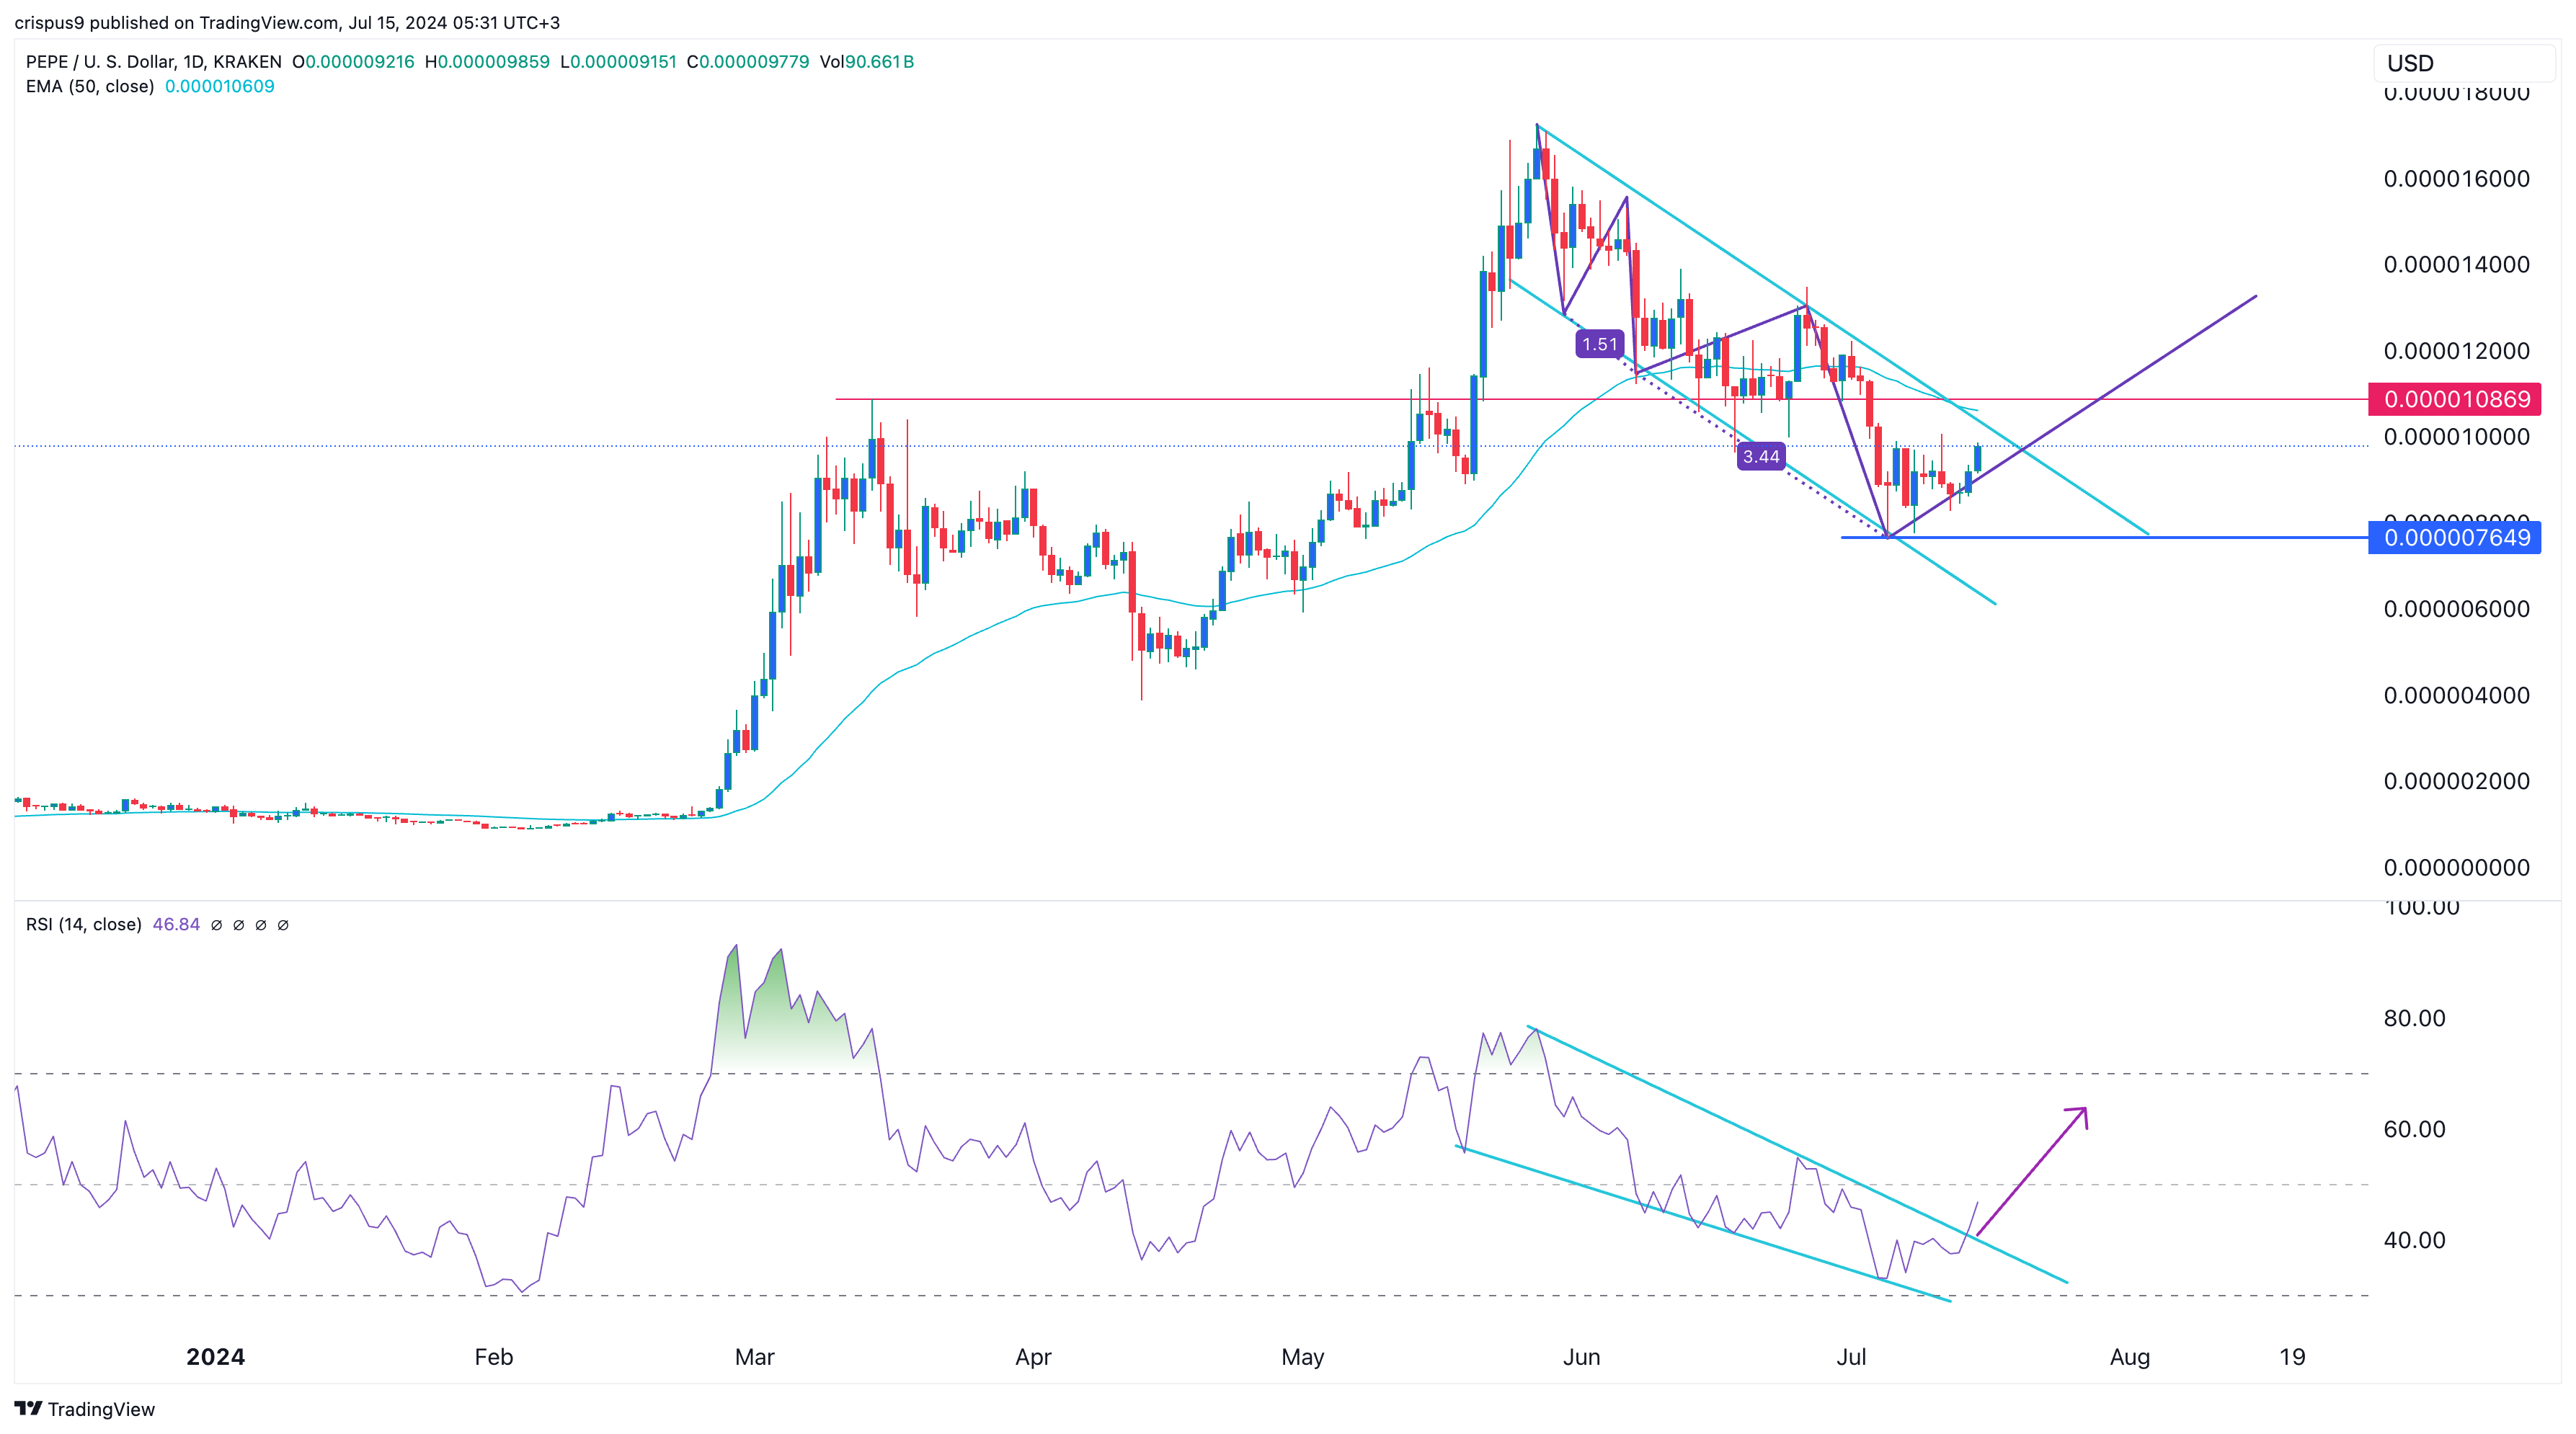
In the daily chart, Pepe’s Relative Strength Index (RSI) has formed a falling wedge pattern, which is considered one of the most bearish chart patterns in technical analysis. Recently, the RSI has moved above the upper side of this wedge pattern, indicating bearish dominance.
This observation will be confirmed if the RSI rises above the neutral point of 50. The RSI is a widely used oscillator that measures an asset’s rate or speed of change.
Additionally, Pepe has formed a three-drive chart pattern, shown in pink. It has now reached the final phase of this pattern, suggesting that a bullish breakout could occur soon. This view will be confirmed if the token rises above the upper side of the falling trendline.
Pepe’s Fibonacci retracements
Pepe has formed other bullish technical patterns. For example, it has created a descending channel pattern and is now nearing its upper side. A bullish breakout is usually confirmed if it moves above the upper side of this pattern.
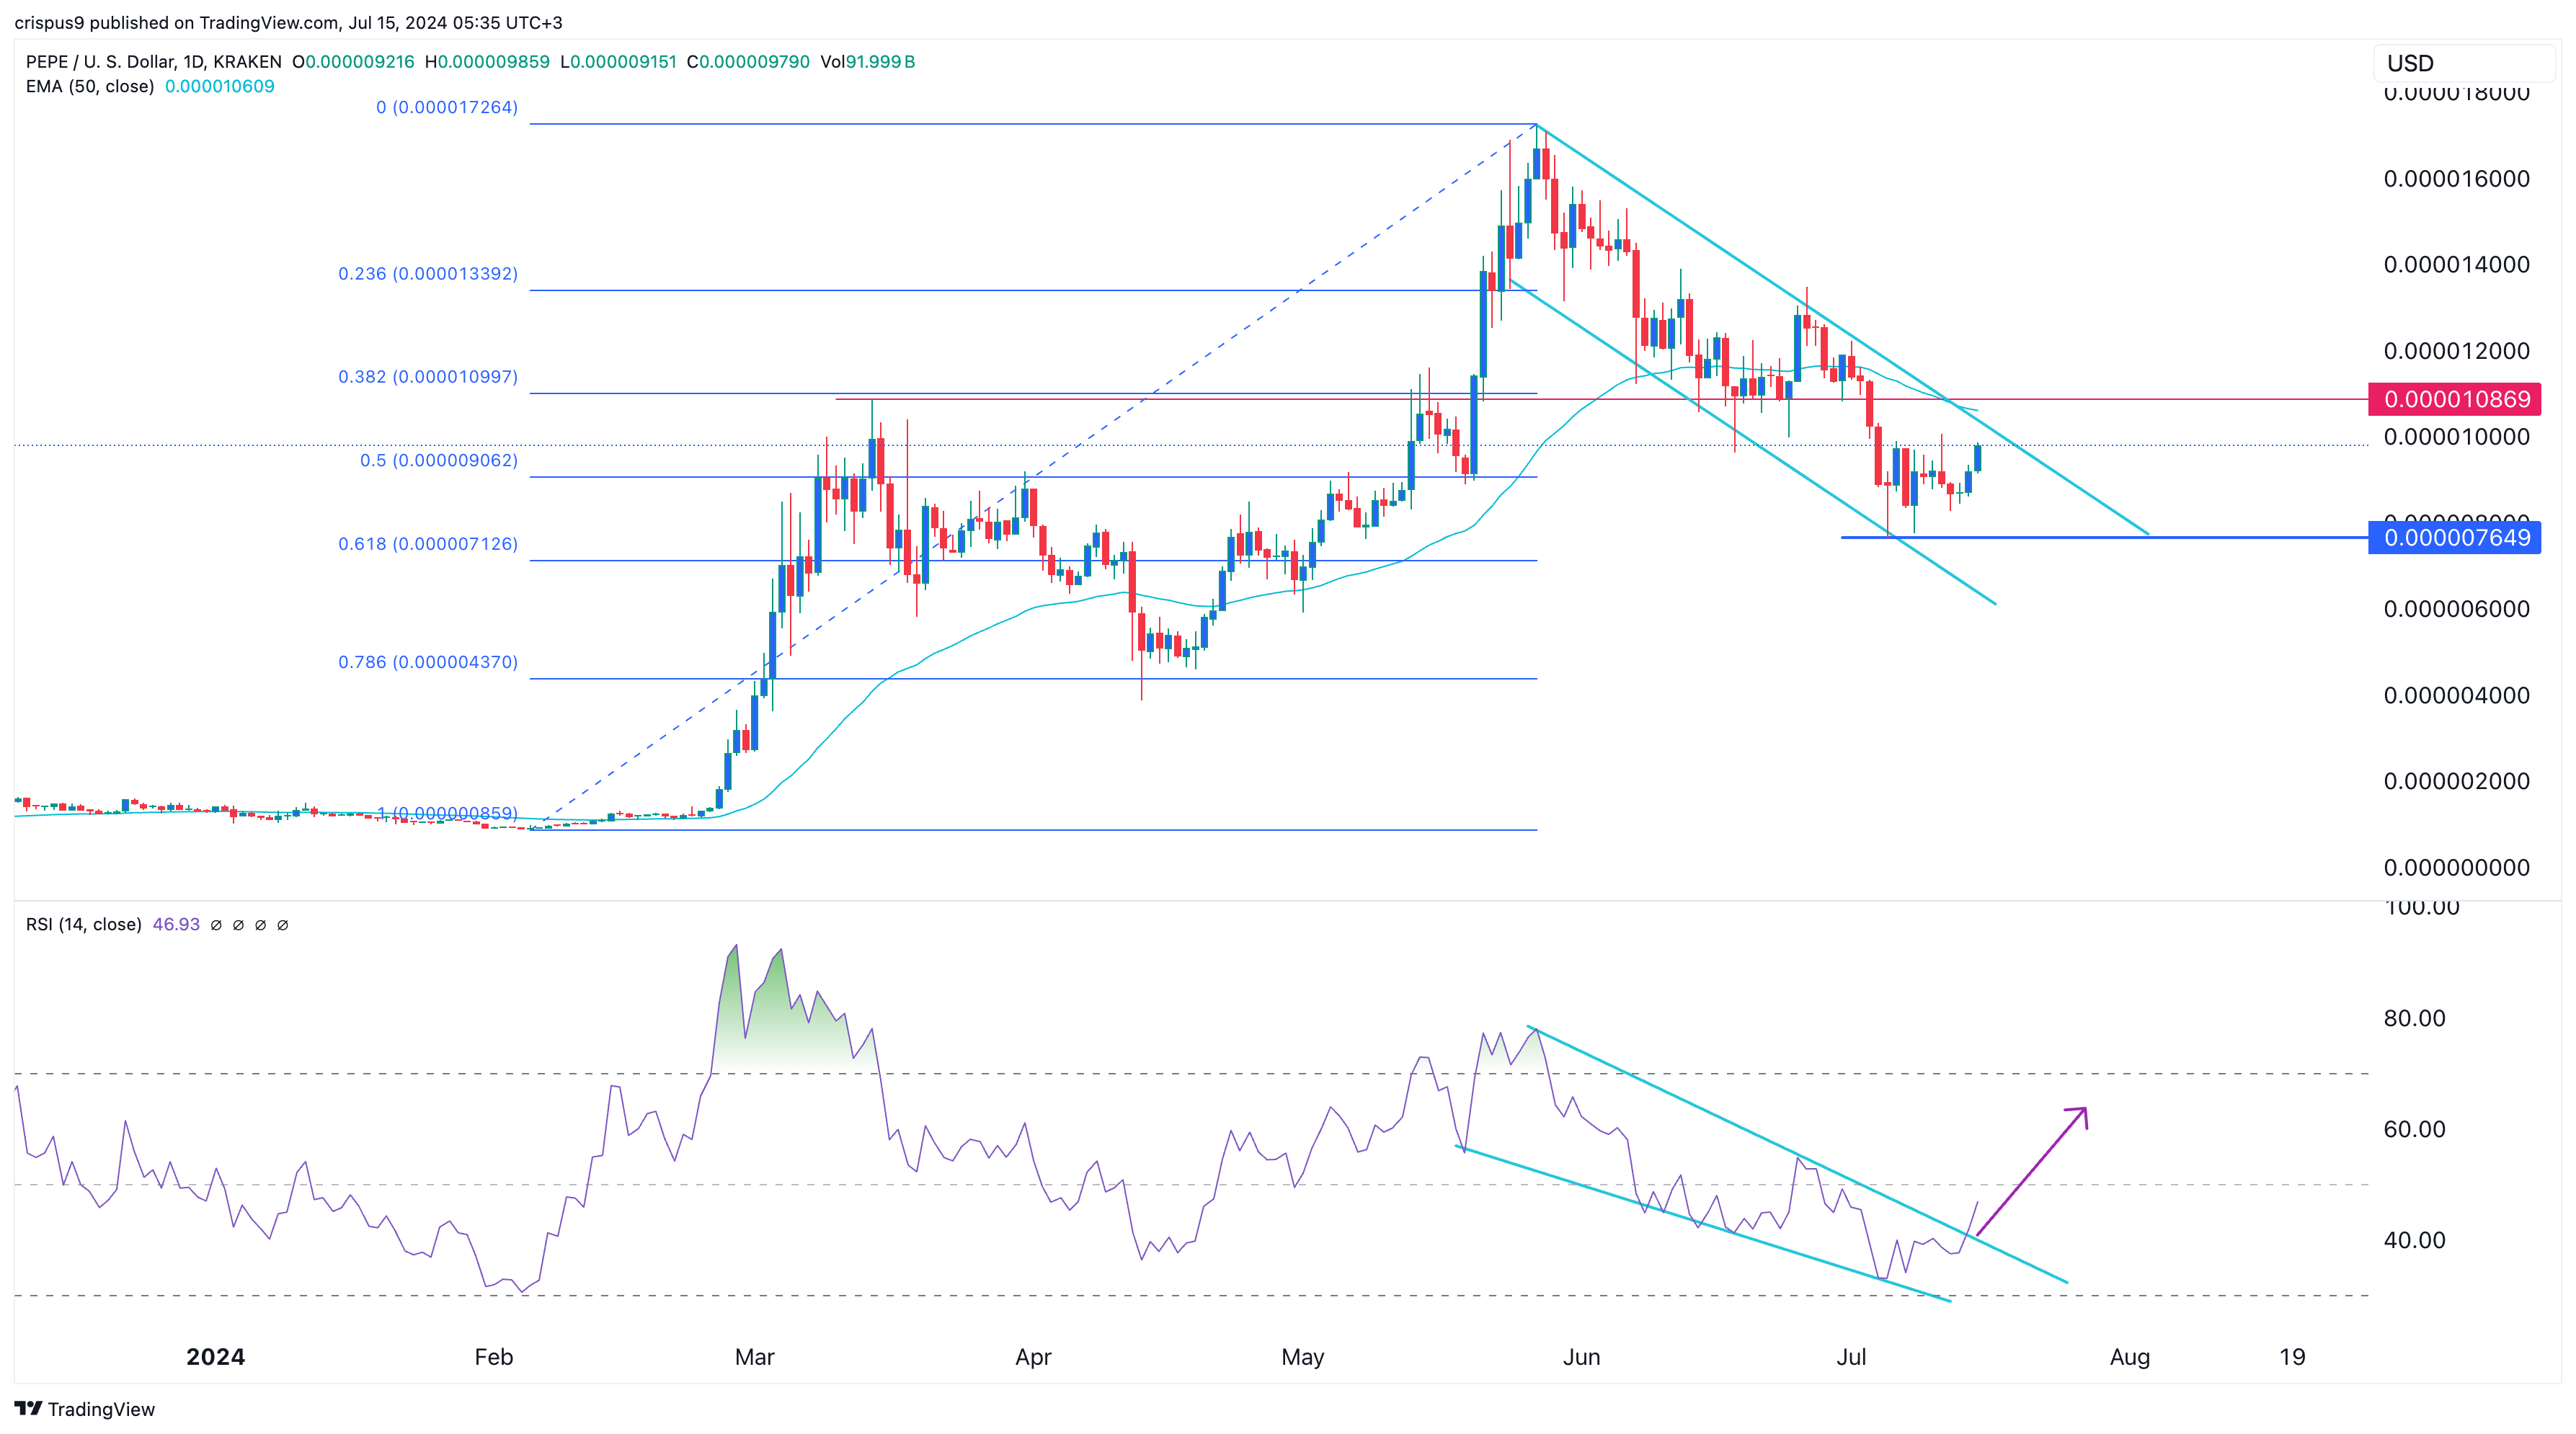
The token also formed a long-legged doji candlestick on July 5th and has moved above the 50% Fibonacci Retracement point. Therefore, more gains will be confirmed if the price moves above the upper side of the channel and the key resistance point at $0.00001085, its highest point on March 14 and 38.2% retracement point.
Pepe’s volume also supports this contrarian view. Data by CoinGecko shows that the 24-hour volume stood at $900 million, higher than Sunday’s $526 million. Pepe has constantly had higher volume than bigger meme coins like Shiba Inu and Dogecoin.
Therefore, a break above $0.0000108 will confirm the bullish view and see it rise to the next point at $0.000013, the 23.6% retracement point.


