

Bitcoin Cash (BCH) is signaling a potential breakout after months of muted activity and underperforming when compared to other cryptocurrencies. Increasing trading volumes, favorable technical indicators, and positive analyst sentiments have caused traders to set ambitious price targets, some reaching as high as $1,500.
At the time of writing, Bitcoin Cash was trading for around $373, a 6.10% increase in the past 24 hours. Its market cap is $7.42 billion, and its 24-hour trading volume is over $380 million.
Bitcoin Cash Bullish Breakout Confirmed on the Charts
According to popular crypto analyst Javon Marks, BCH has recently broken out of a long-standing downtrend, with his chart showing the coin breaking through descending resistance levels, and the current price structure suggesting a continuation of this rally.
Marks projects that this could contribute to a 300% surge that could eventually take the Bitcoin Cash price to $1,509.89.
In a previous tweet, Marks also pointed out that BCH has already climbed over 150% since its initial breakout and maintains the potential for another 375% increase if momentum continues.
Volume Spike Signals Accumulation Phase Ending
BCH’s volume data indicates an increase in buying activity. On CoinMarketCap and TradingView, the 24-hour volume has surged by more than 62%. This often signals growing trader interest. This sudden influx of volume usually precedes a larger market move, especially when aligned with a breakout pattern.
The TradingView chart shows Bitcoin Cash (BCH) is displaying strong technical momentum, with the daily RSI rising steadily and the MACD signaling a bullish crossover.
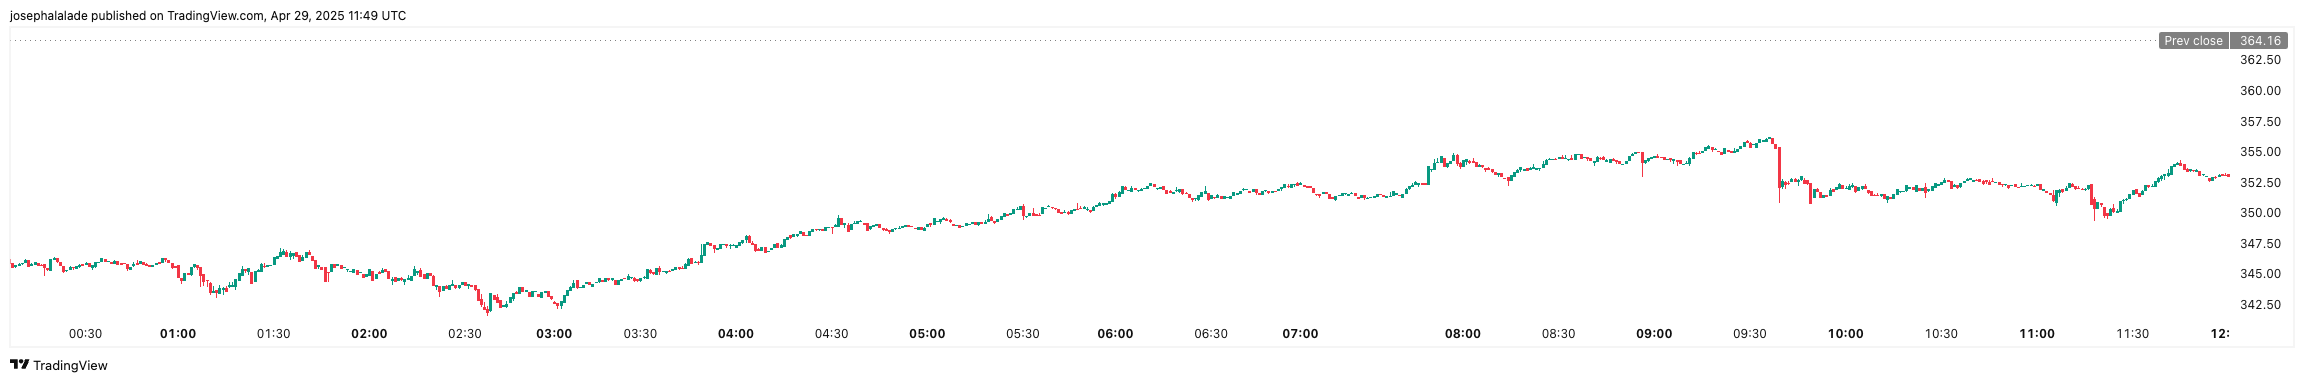
Price action has remained stable around the $340–$360 support zone, and with BCH having traded above $370, it appears to be forming a new local floor. Recent upward wicks, which refer to the thin lines on candlestick charts indicating price movement, suggest strong buying interest, indicating bulls are absorbing sell pressure.
Key resistance levels to watch include $420, $500, $800, and potentially $1,500—a target supported by long-term chart projections. While a dip to $345–$350 remains possible if momentum stalls, the current trend favors continued upside.
READ MORE: Cardano (ADA) Price Eyes $1.25 As It Holds Above Key Support