


Bitcoin price remains in a tight range as investors focus on the ongoing trade war between the United States and China, as well as the tumbling US dollar index (DXY). BTC was trading at $84,000 on Tuesday morning, down from this week’s high of $86,450. This article explores what to expect as the US dollar index (DXY) has formed a giant cup-and-handle pattern.
Bitcoin Price Analysis as the US Dollar Index Plunges
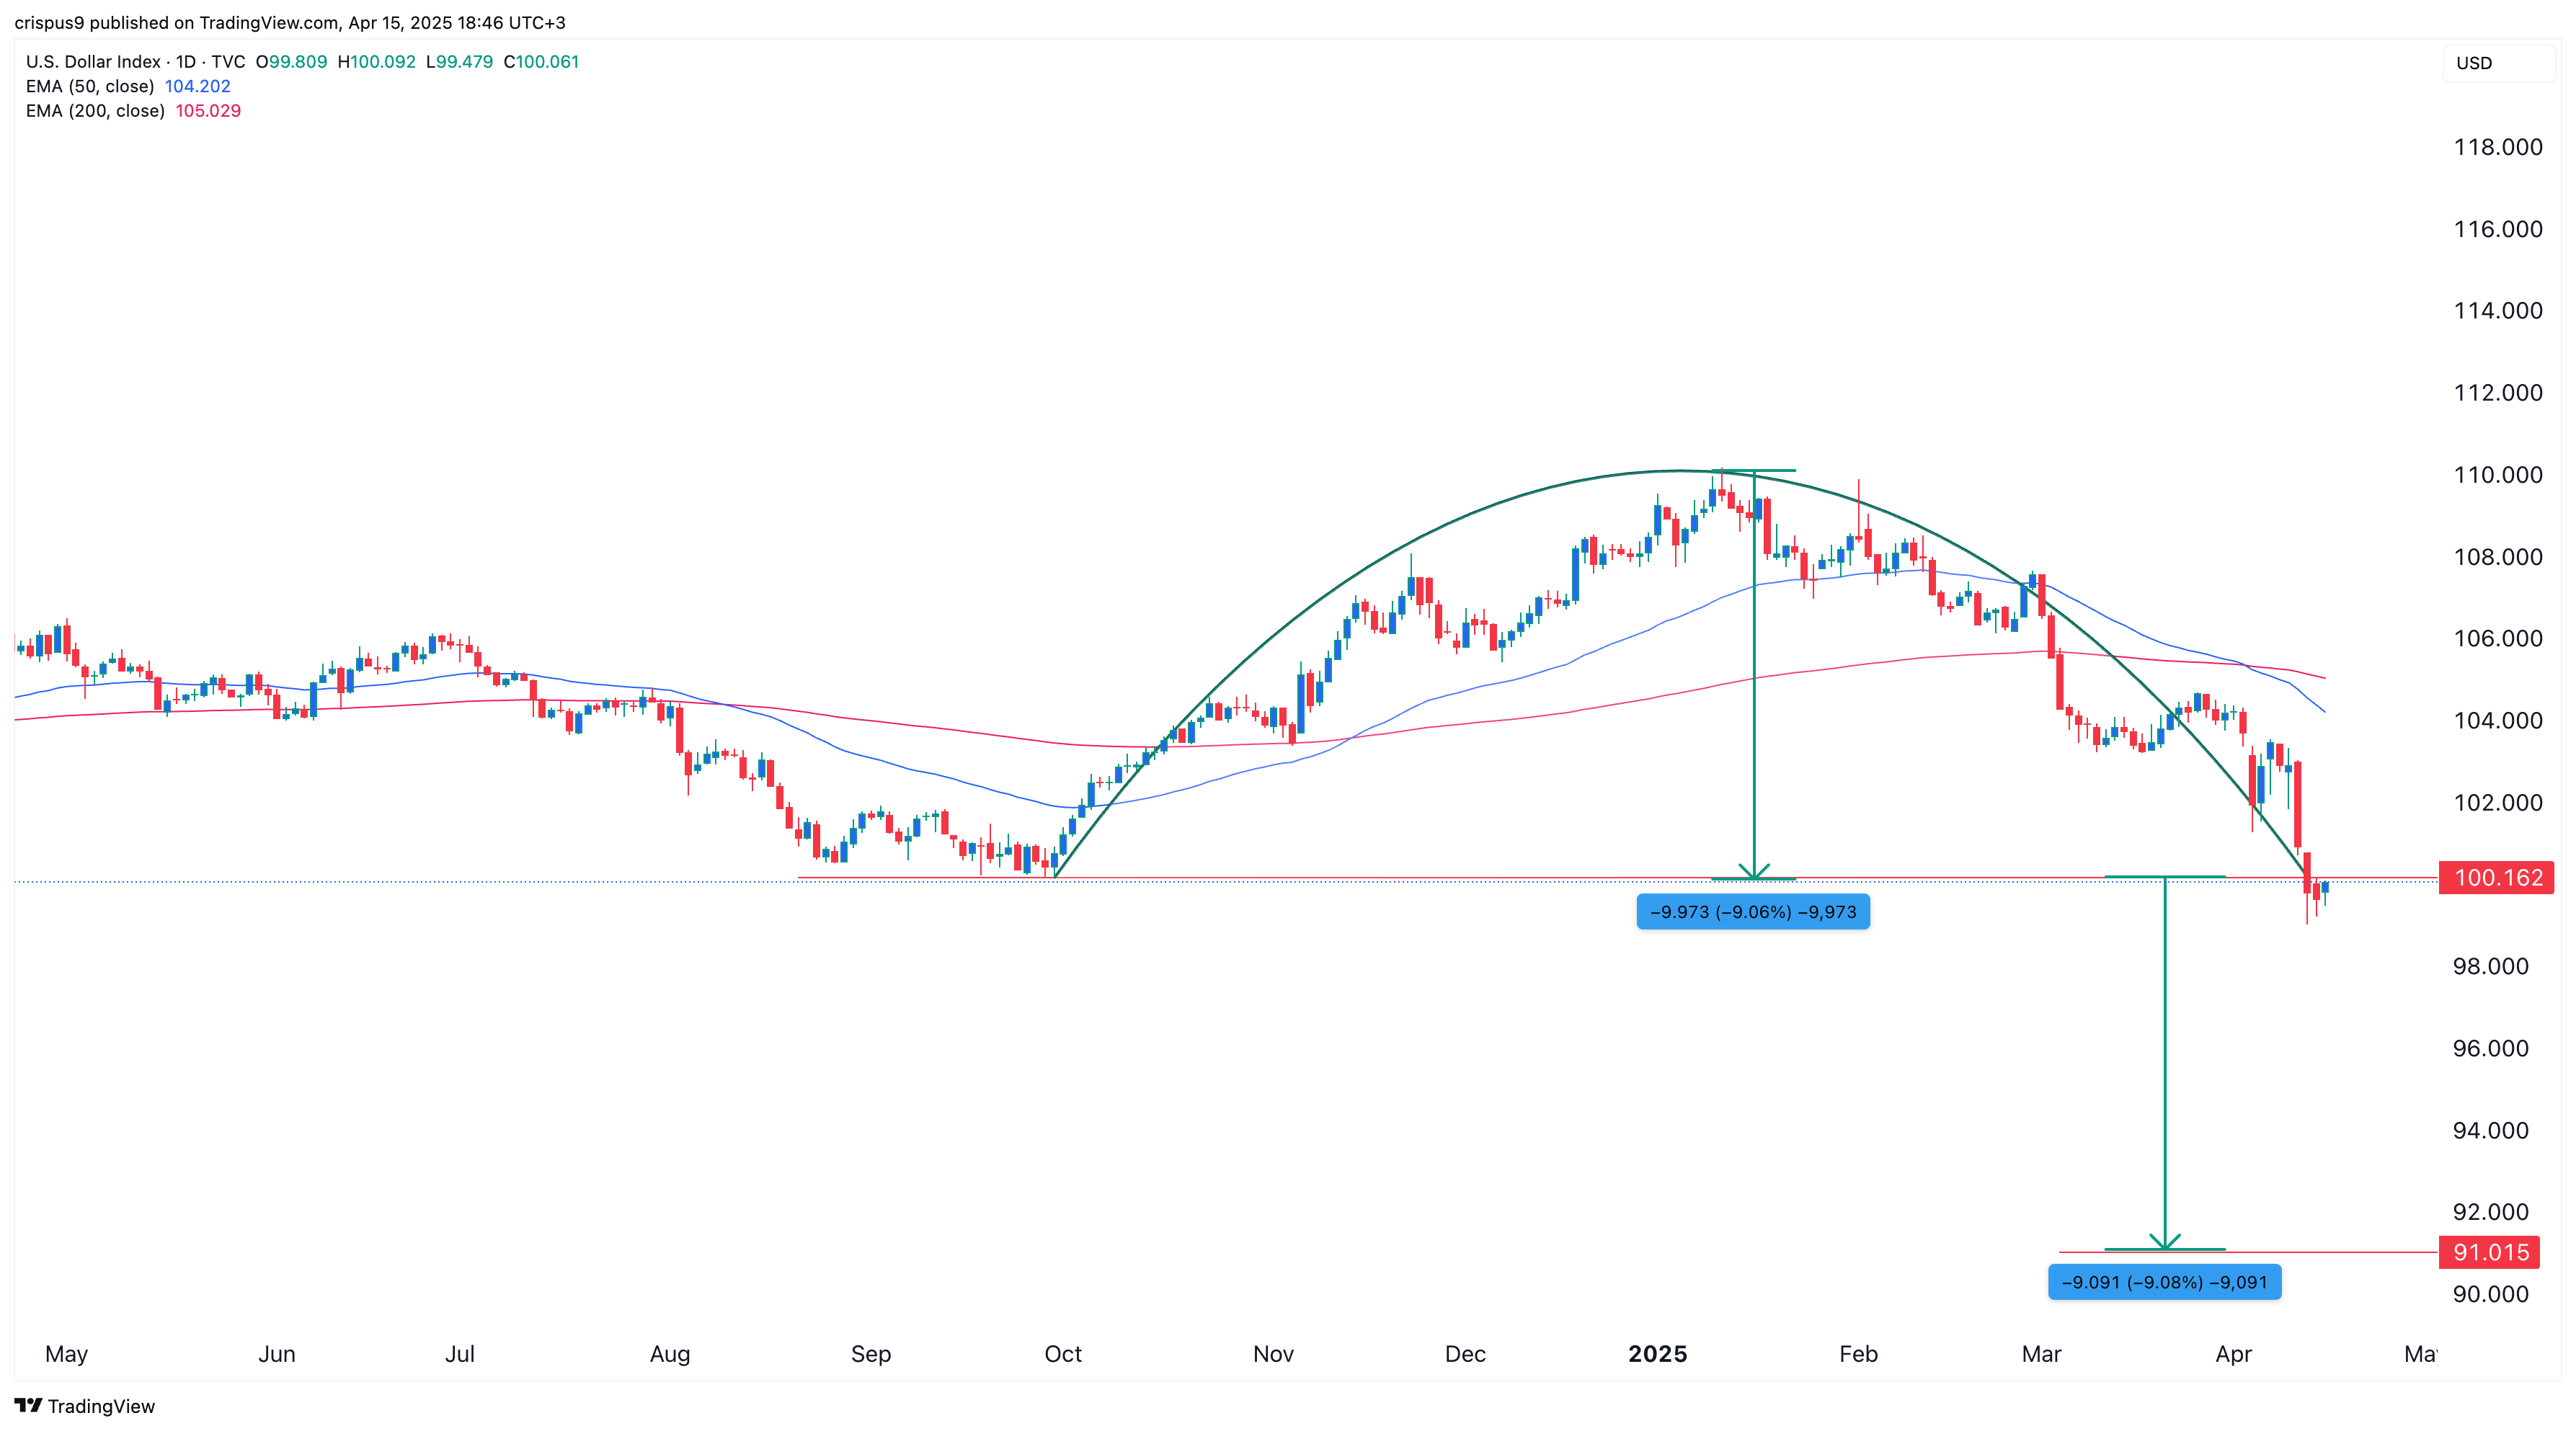
One of the main catalysts for the Bitcoin price is the US dollar index’s crash in the past few weeks. After peaking at $110 earlier this month, the DXY index plunged to $99 and formed a death cross as the 50-day and 200-day Exponential Moving Averages (EMA) crossed each other. A death cross is one of the most bearish patterns in the market.
The greenback has also formed an inverse cup and handle pattern, which is made up of a horizontal line, a rounded top, and some consolidation. The depth of this pattern is about 9%, meaning that a measurement from the lower side of the cup would push it to the next key support at $91.
The US dollar index has imploded as investors focus on the ongoing trade war and question the currency’s role as a safe haven. Instead, currencies from other countries, especially the Swiss franc, have become safer havens this year.
The falling US dollar may be a good catalyst for Bitcoin, which explains why its price has not fallen sharply this year. Bitcoin is typically traded in US dollars, appreciating as the currency declines.
Also, the falling DXY index indicates that the Federal Reserve may be forced to intervene in the market, which will be a good catalyst for risky assets.
BTC Price Technical Analysis
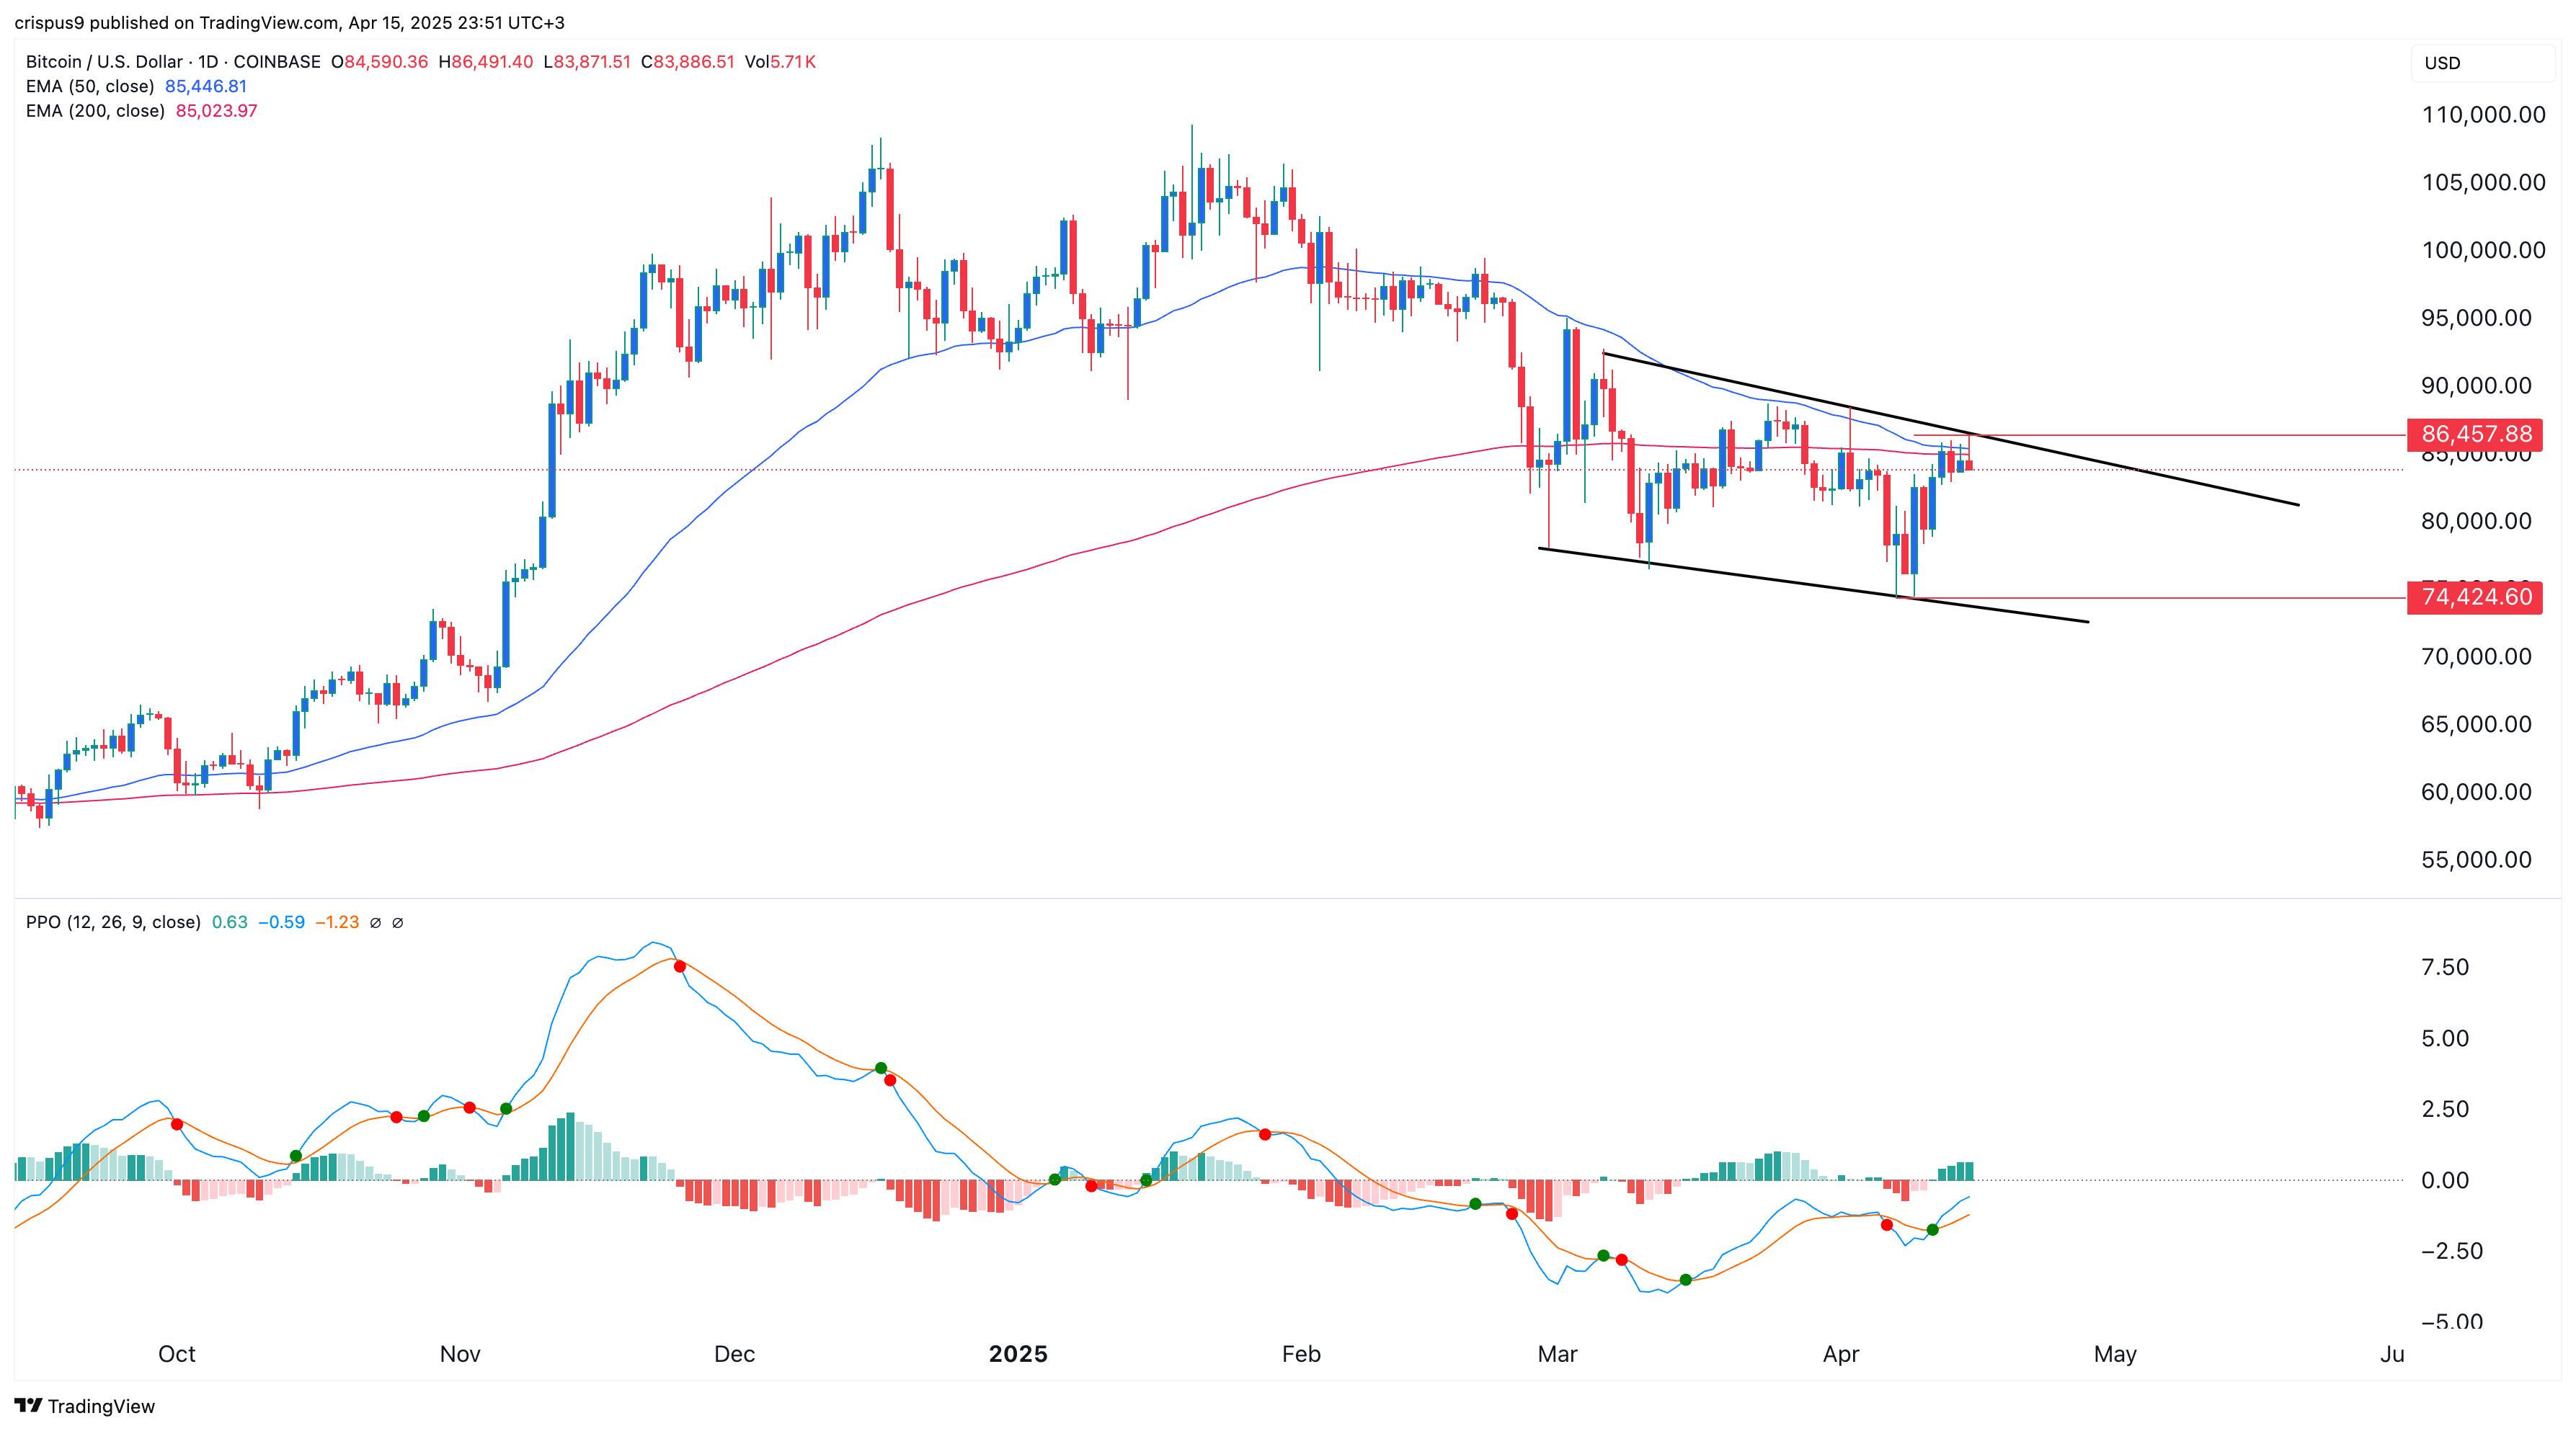
The daily chart shows that the BTC price has been in a strong downtrend in the past few days. It has remained slightly along the upper side of the descending channel, as shown in black.
Also, Bitcoin’s price is about to form a death cross as the 50-day and 200-day moving averages are set to cross each other. Therefore, the coin is likely to experience a bearish breakdown, with the next point to watch being at $74,425, the lower side of the channel.
However, a move above the upper side of the falling channel will invalidate the bearish Bitcoin price forecast.
READ MORE: Bitcoin Price Shows Bottoming Signs as BTC ETF Outflows Continue