


XRP price rose to a crucial resistance level, with on-chain data indicating higher valuation and slow network growth. Ripple jumped to a high of $2.42 on Monday, up 35% from its lowest point this month. This article explores whether XRP has more upside ahead and the key levels to watch.
XRP Price Technical Analysis
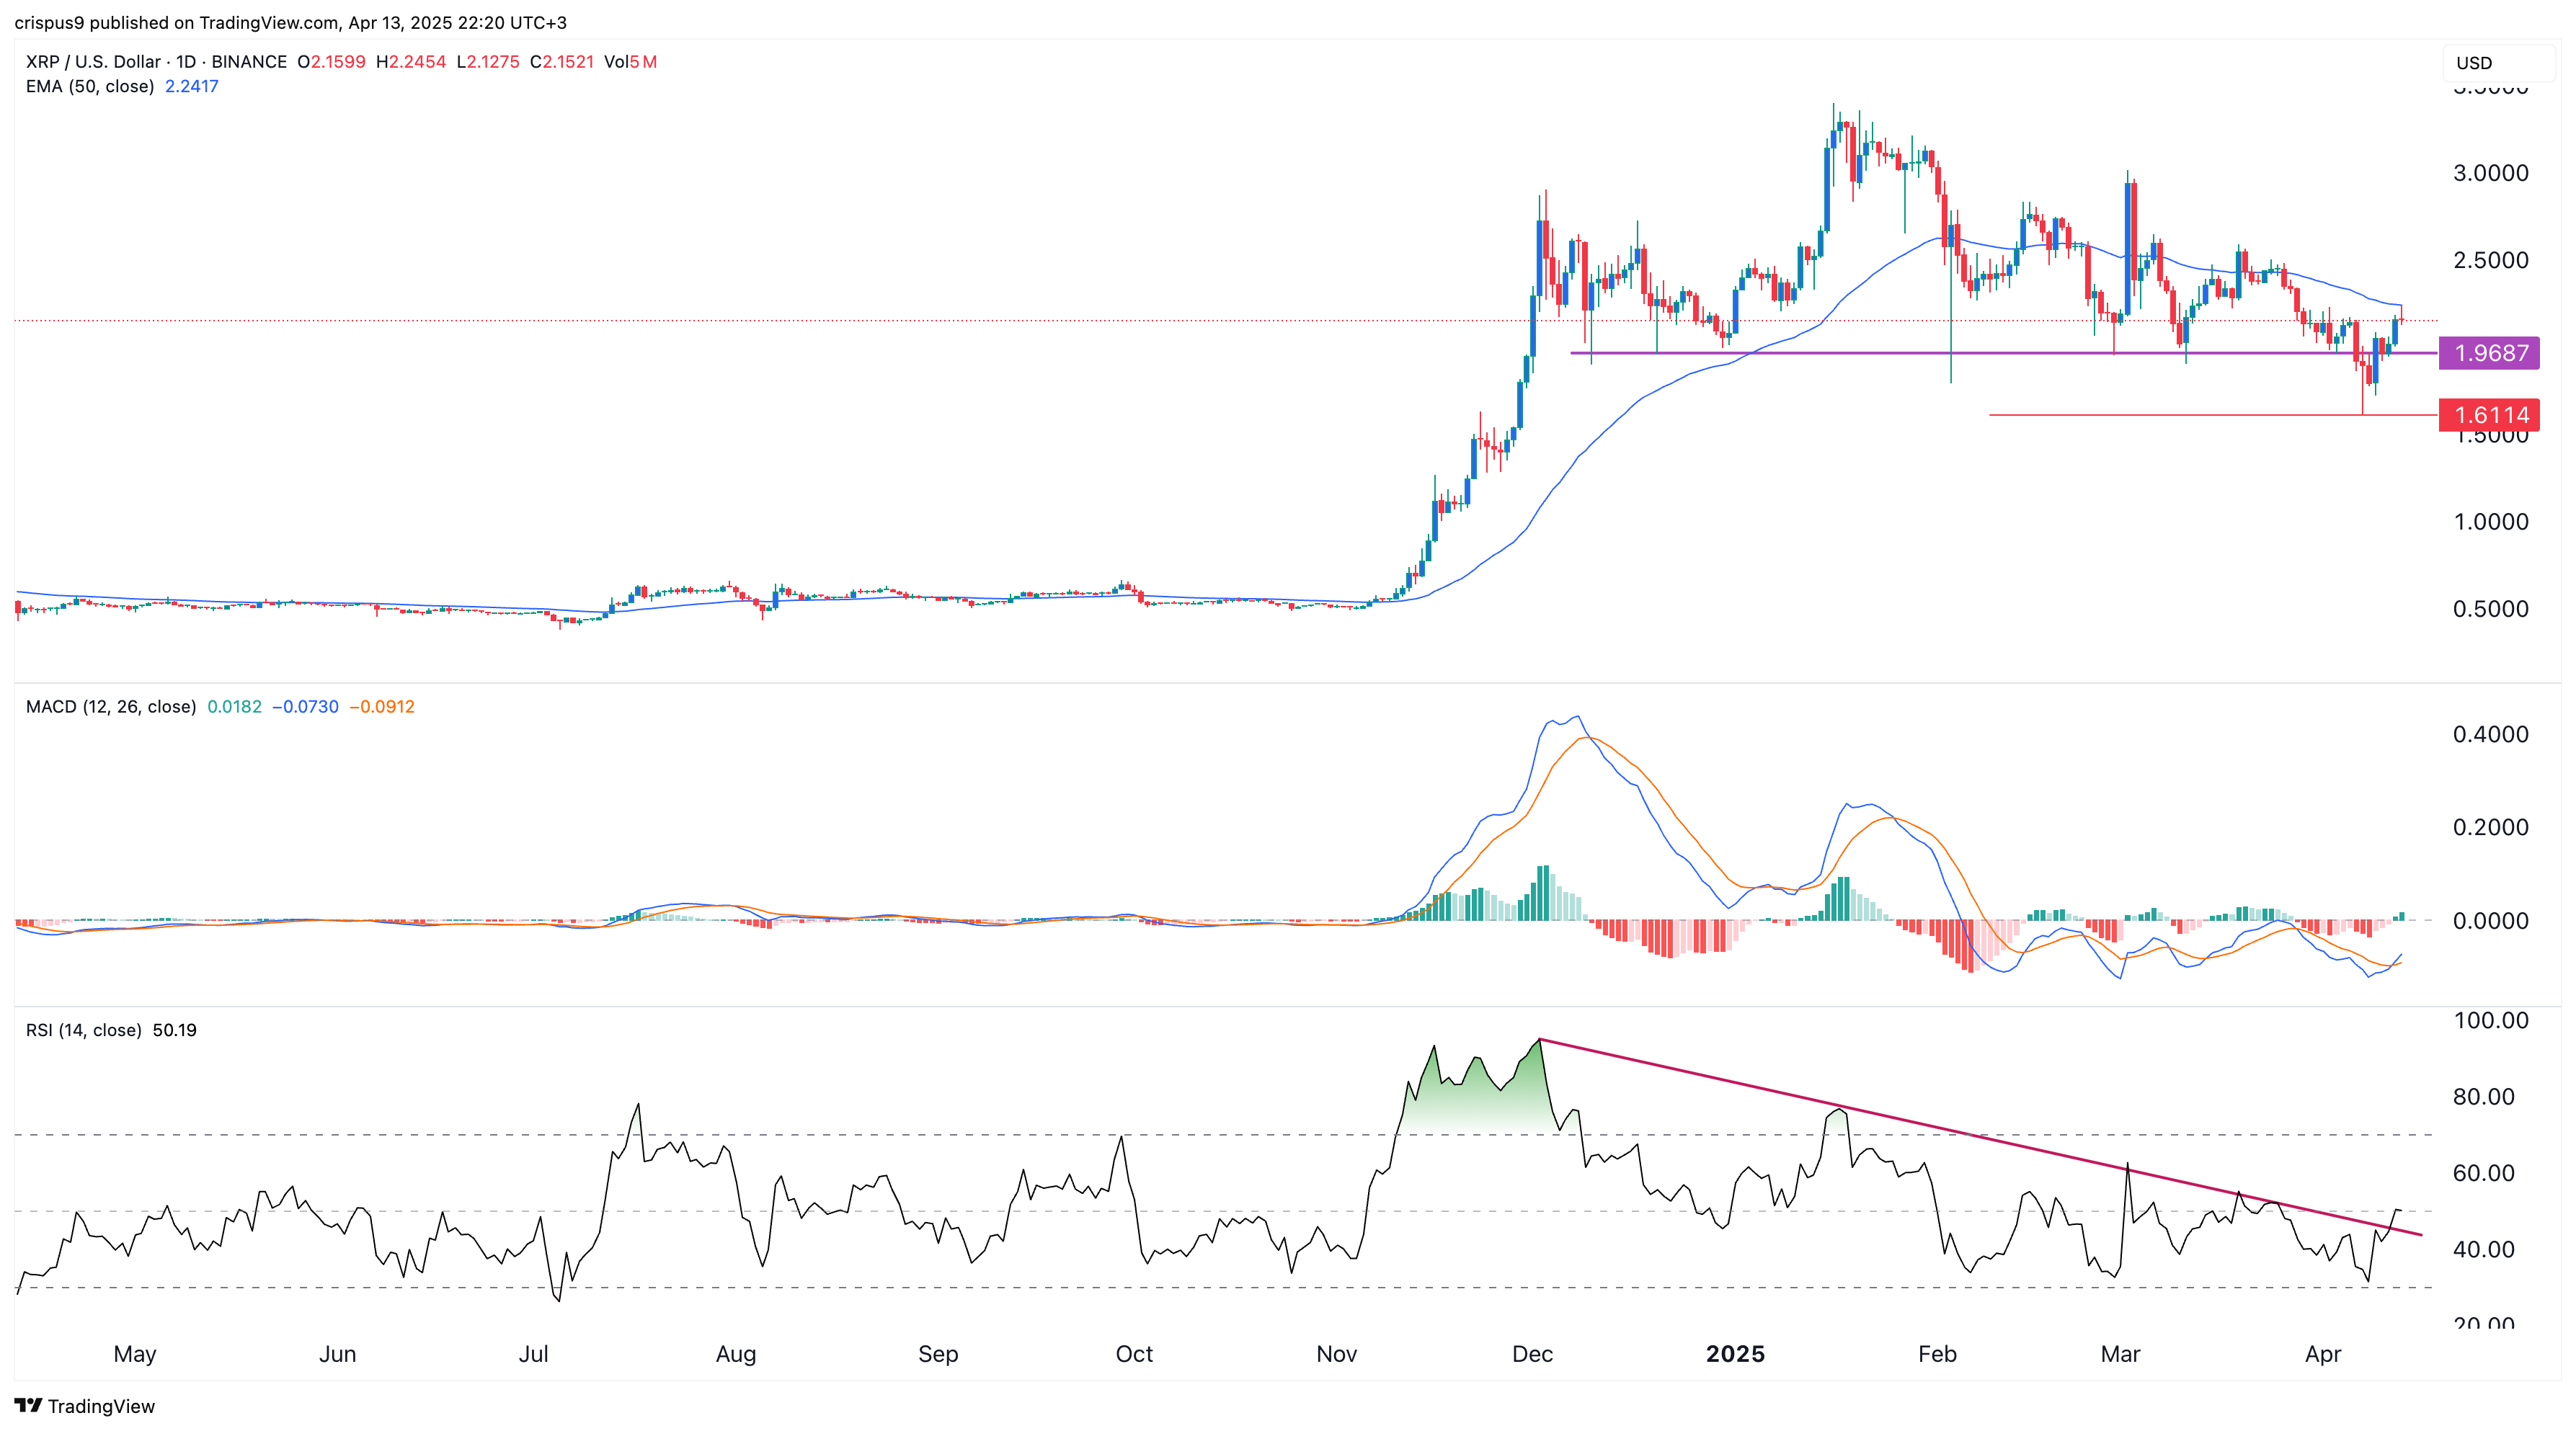
The daily chart shows that the XRP price bottomed at $1.6115 last week and bounced back to $2.15 today. It has moved slightly above the important resistance point at $1.9685, the neckline of the head-and-shoulders sign.
Ripple (XRP) has now moved to the important resistance at $2.15, the 50-day Exponential Moving Average (EMA). It needs to move above this resistance to confirm more upside in the near term.
On the positive side, the Relative Strength Index (RSI) has pointed upward. The coin has now moved above the descending trendline that connects the highest swings since December 2 last year.
The two lines of the MACD have formed a bullish crossover, indicating it is starting to gain momentum. Therefore, a break above the 50-day moving average will point to further gains, potentially to $2.5.
The bearish outlook of the head and shoulders pattern will become invalid if the coin rises above the key resistance level at $3.0. A move below last week’s low of $1.6115 would validate the bearish outlook and point to more downside, potentially to $1.
READ MORE: XRP Price Prediction: Ripple Needs to Overcome 3 Key Risks
Ripple On-Chain Analysis
On-chain data is sending mixed signals about the XRP price in the near term. First, as shown above, the number of active addresses has continued to fall in recent days. On Monday, it had just 28,300 active addresses, its lowest level in a long time. This figure has been in a strong downtrend, falling from a peak of 620,000 last month.
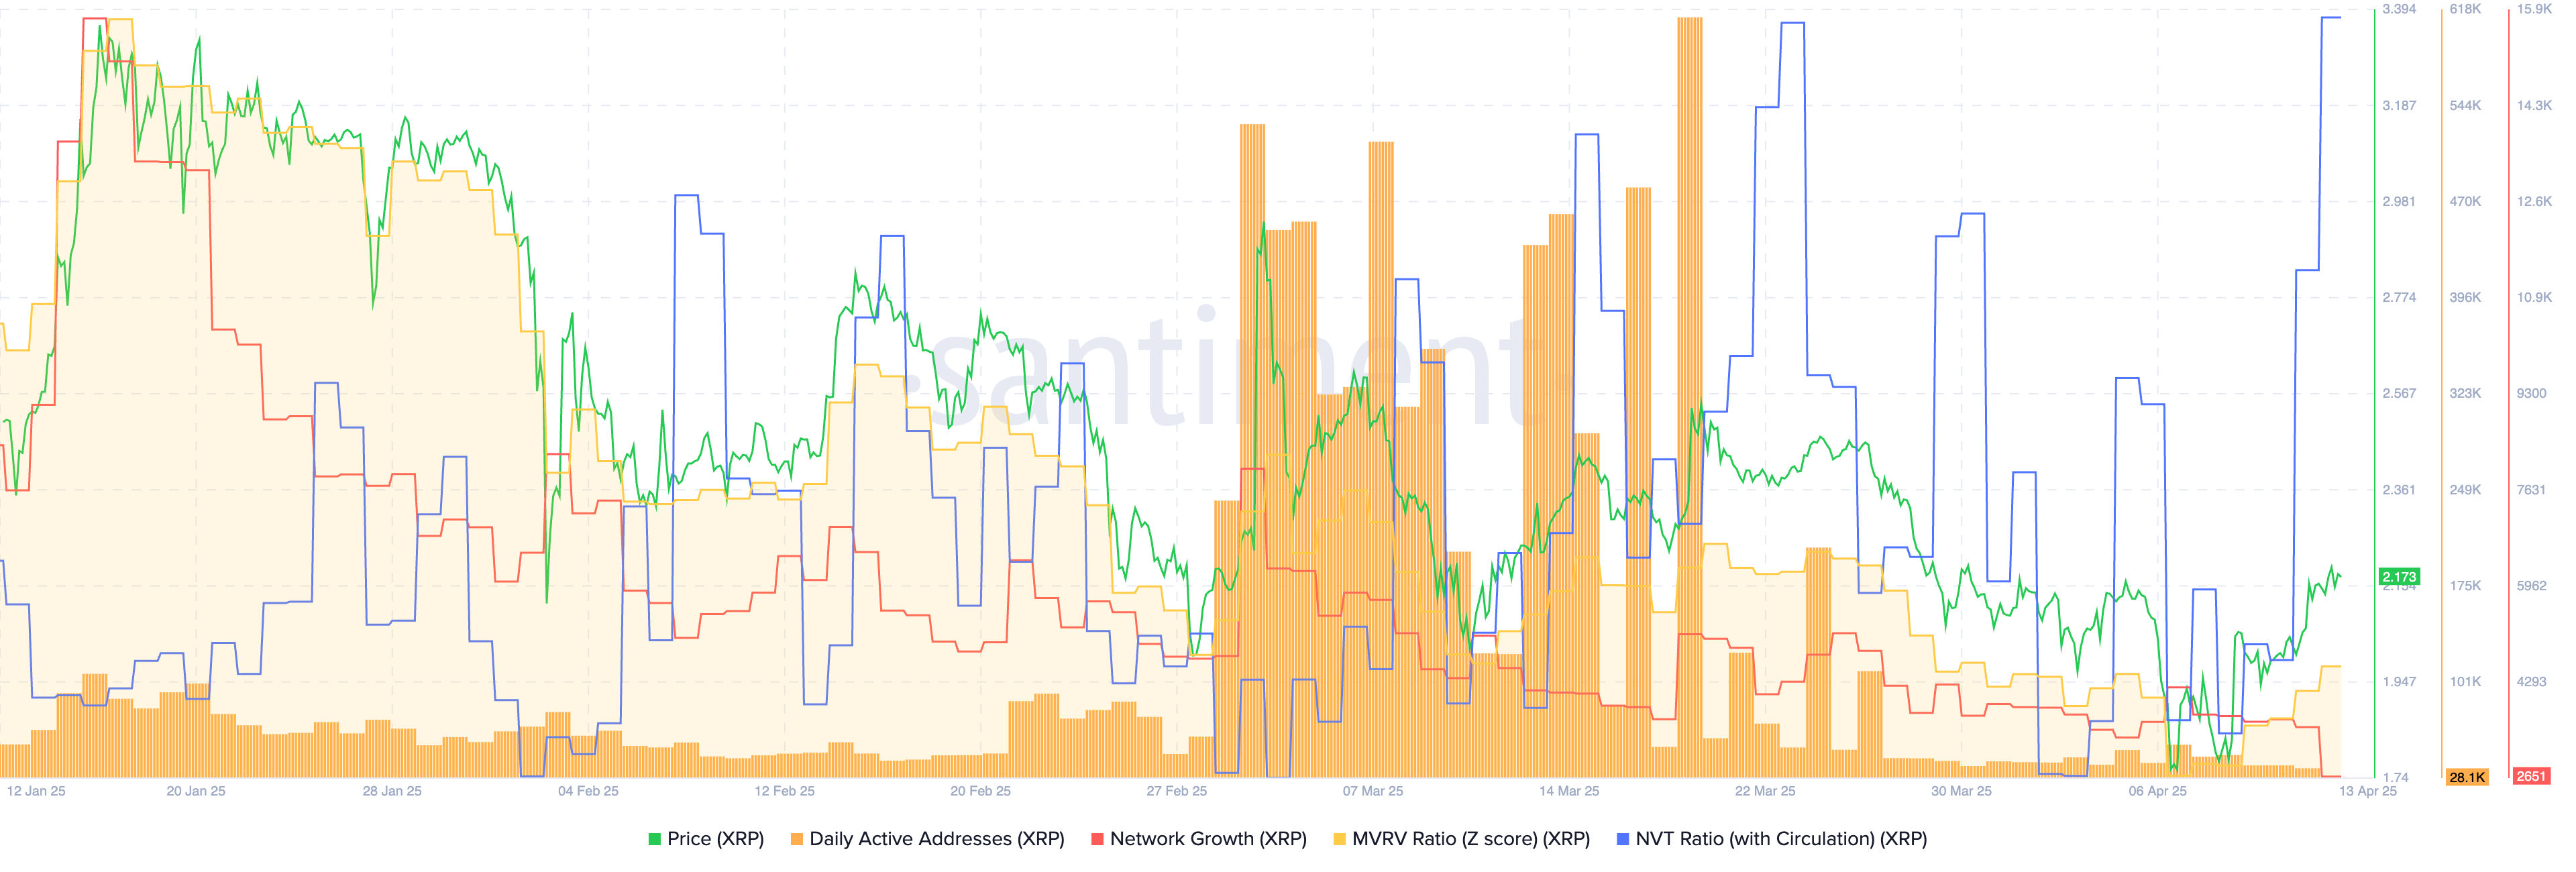
Second, network growth has stalled. It dropped from over 15,000 in January to less than 3,000 today, indicating waning token activity this month.
Third, XRP is increasingly overvalued as the MVRV indicator rose to 2.35 on Monday, its highest level since March 28.
Most importantly, the net value to transaction (NVT) ratio has gone parabolic, indicating its price is driven more by speculation than network usage. It jumped to 1,554 on Monday from this month’s low of 165.
These on-chain metrics suggest that the XRP price may remain under pressure, especially since it has moved to a crucial resistance.
READ MORE: Buy, Sell, Hold? XRP Price Prediction Reveals Key Targets