


There are signs that Bitcoin’s price is bottoming even as outflows from its spot ETFs accelerate. The BTC price rose to over $83,200 on Friday, which is an increase of almost 12% from the lowest point this month.
Spot Bitcoin ETFs Continue to Shed Assets
Third-party data indicates that investors are abandoning their Bitcoin ETFs this week as recession risks increase.
All these funds lost over $712 million during the week, a big increase from the $172 million they lost a week earlier.
Bitcoin ETFs have experienced net outflows in seven of the last seven weeks. Most of their outflows happened in the last week of February when they lost over $2.48 billion in assets.
Therefore, Bitcoin funds now have net outflows of $35 billion, substantially higher than Ethereum’s $2.5 billion.
This trajectory happened as Bitcoin’s price dropped from the year-to-date high of $109,300 to $83,000 today. Also, the outflows increased as the crypto fear and greed index moved to the fear zone.
Bitcoin ETFs have lost substantial assets due to the ongoing trade war between the US and China. China implemented a 125% tariff on the US on Friday as it reacted to Trump’s tariff surge to 145%. In its statement, Beijing noted that it viewed Trump’s policies as a form of bullying.
The ongoing trade war means that the US may be heading towards a recession this year, with Polymarket odds jumping to over 65%.
On the positive side, a recession would be a bullish catalyst for Bitcoin’s price as it would push the Fed to slash interest rates. This explains why the US dollar index has crashed this week.
Bitcoin Price Technical Analysis
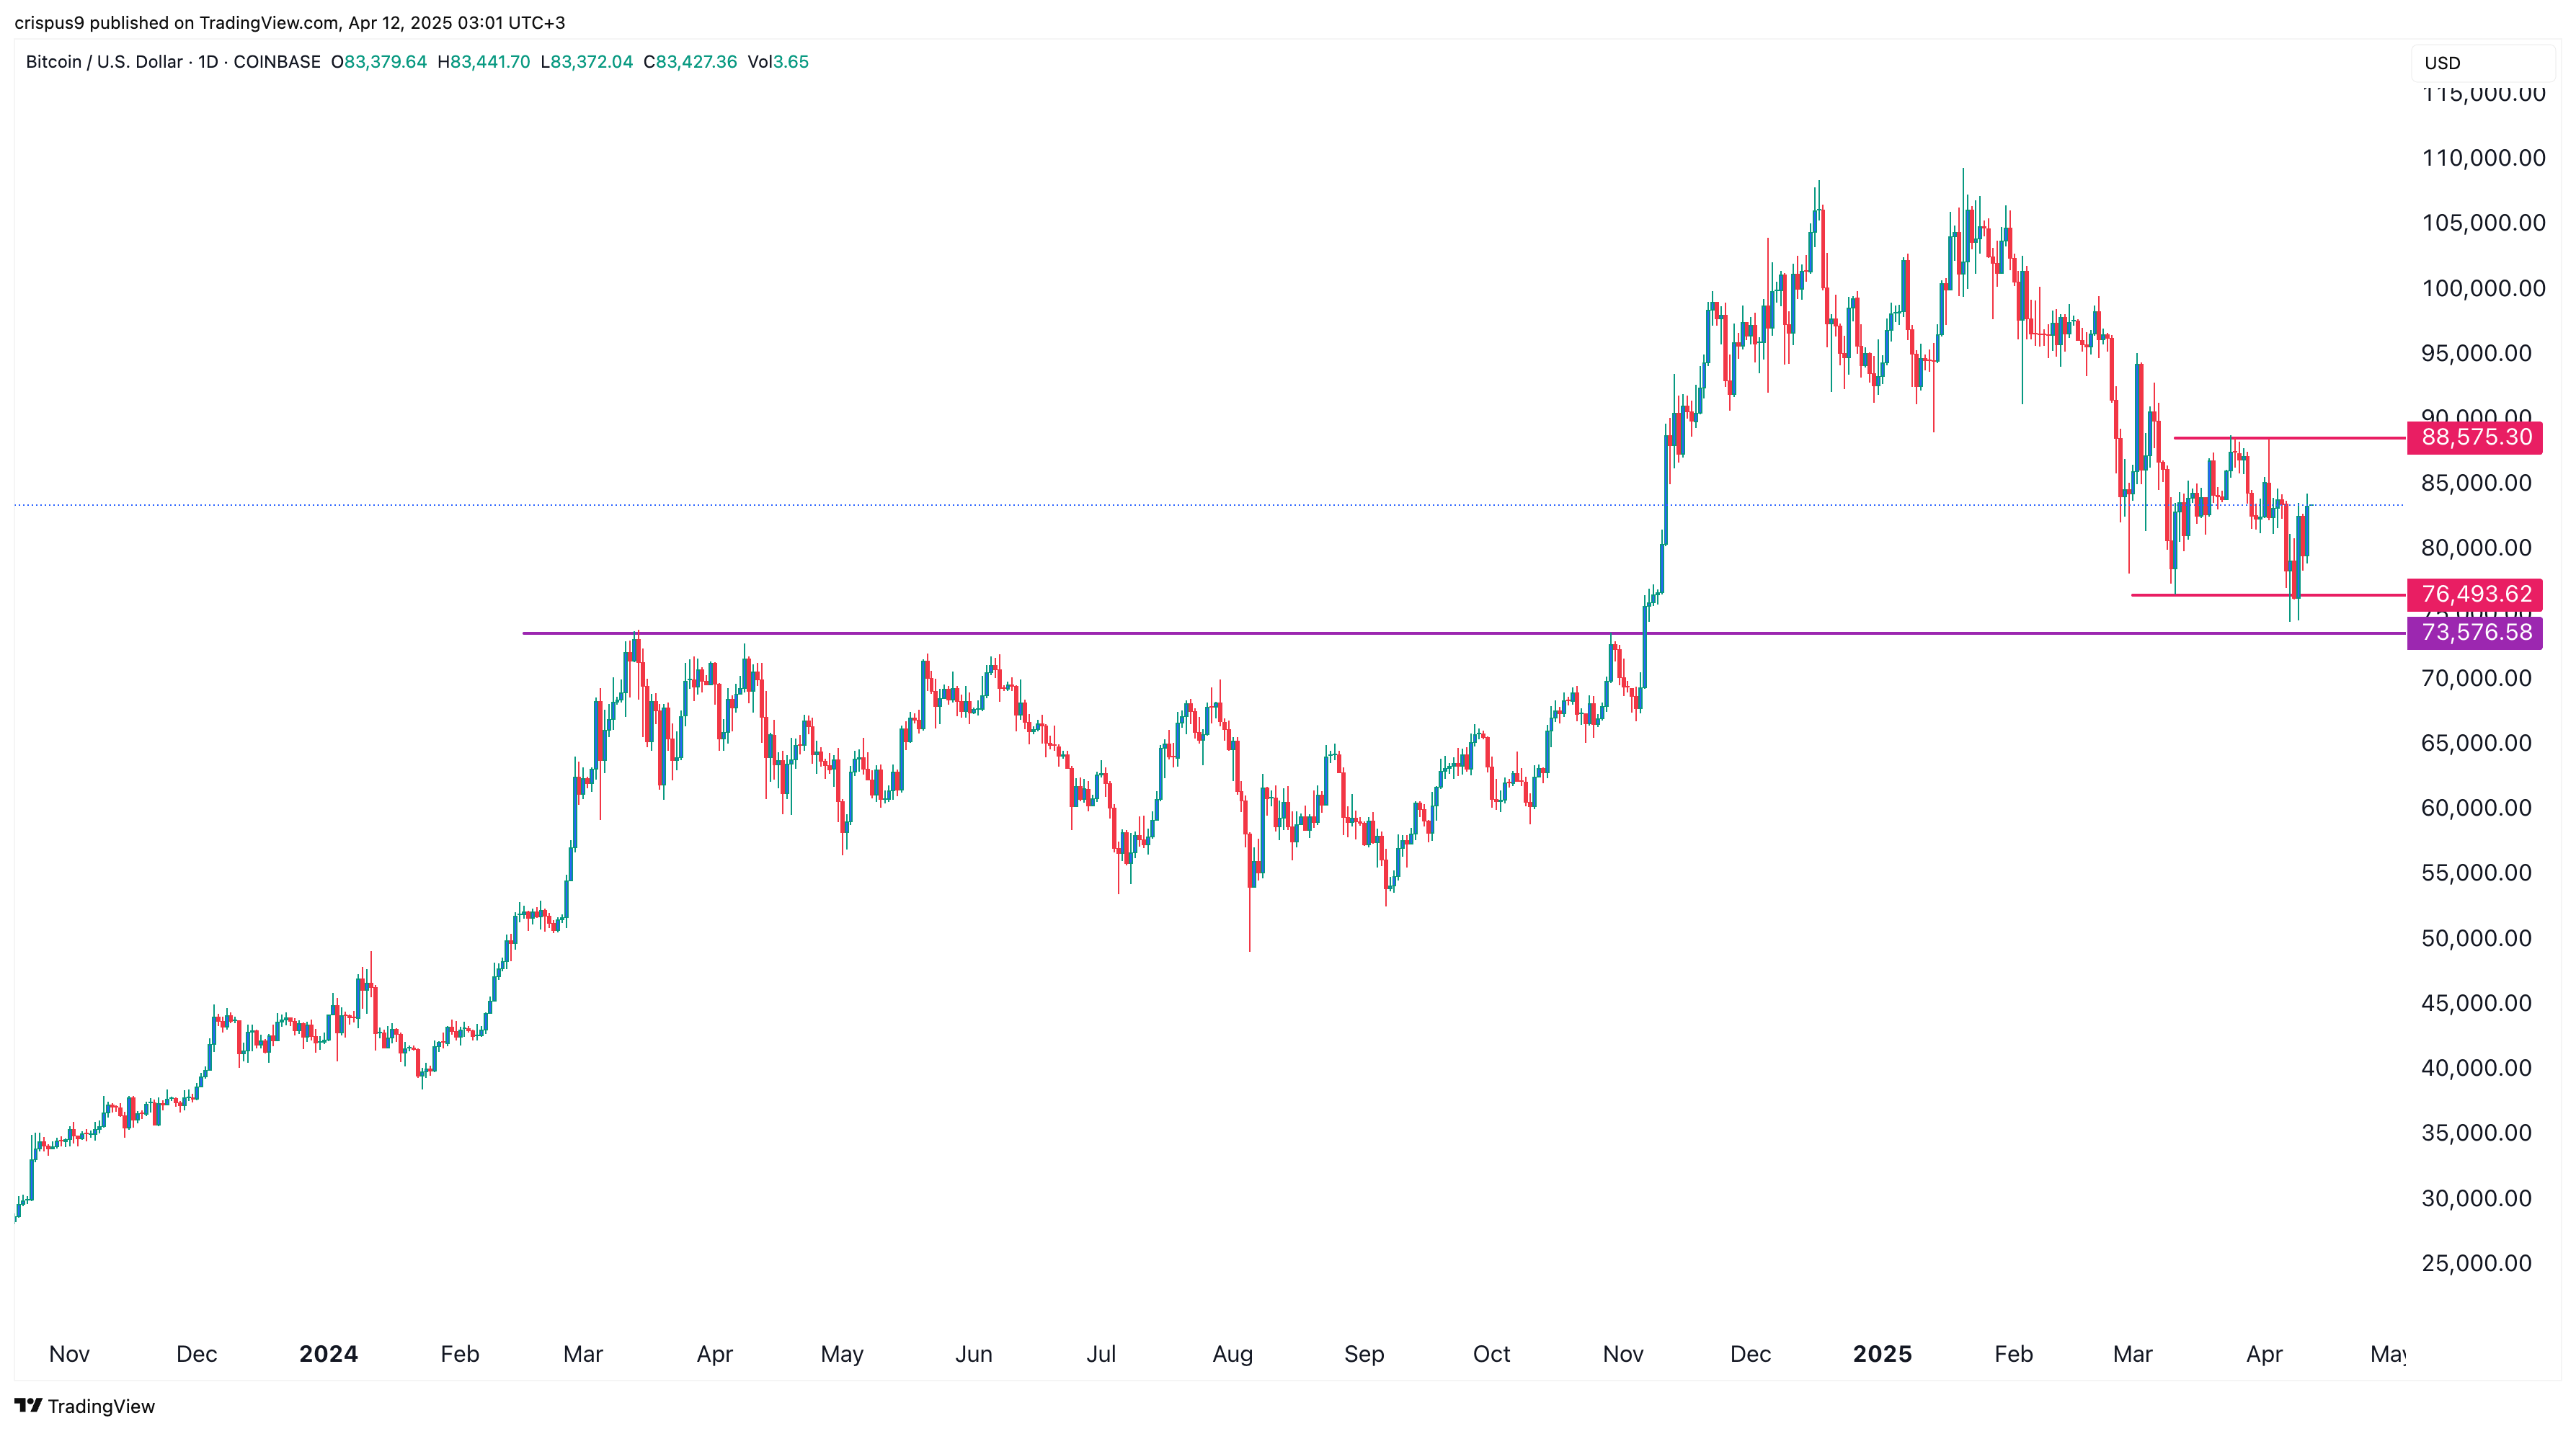
There are signs that the BTC price has bottomed. The chart above shows that the price of Bitcoin dropped to $73,600 this month. This was a notable price since it was near the key support level at $73,576, the highest swing in March last year.
Also, Bitcoin’s price has formed a double-bottom pattern at $76,493. A double-bottom pattern is a highly bullish sign that leads to more gains over time. Therefore, the coin will likely rebound in the coming days, with the next target being at the neckline of $88,575. A drop below the support at $73,575 would invalidate the bullish view.