


The Onyxcoin price went parabolic this week as it outperformed many other large coins, and its wedge pattern worked well. The XCN token jumped to a high of $0.018 on Friday, up 143% from its lowest point this week, giving it a market cap of over $533 million.
Onyxcoin Price Technical Analysis
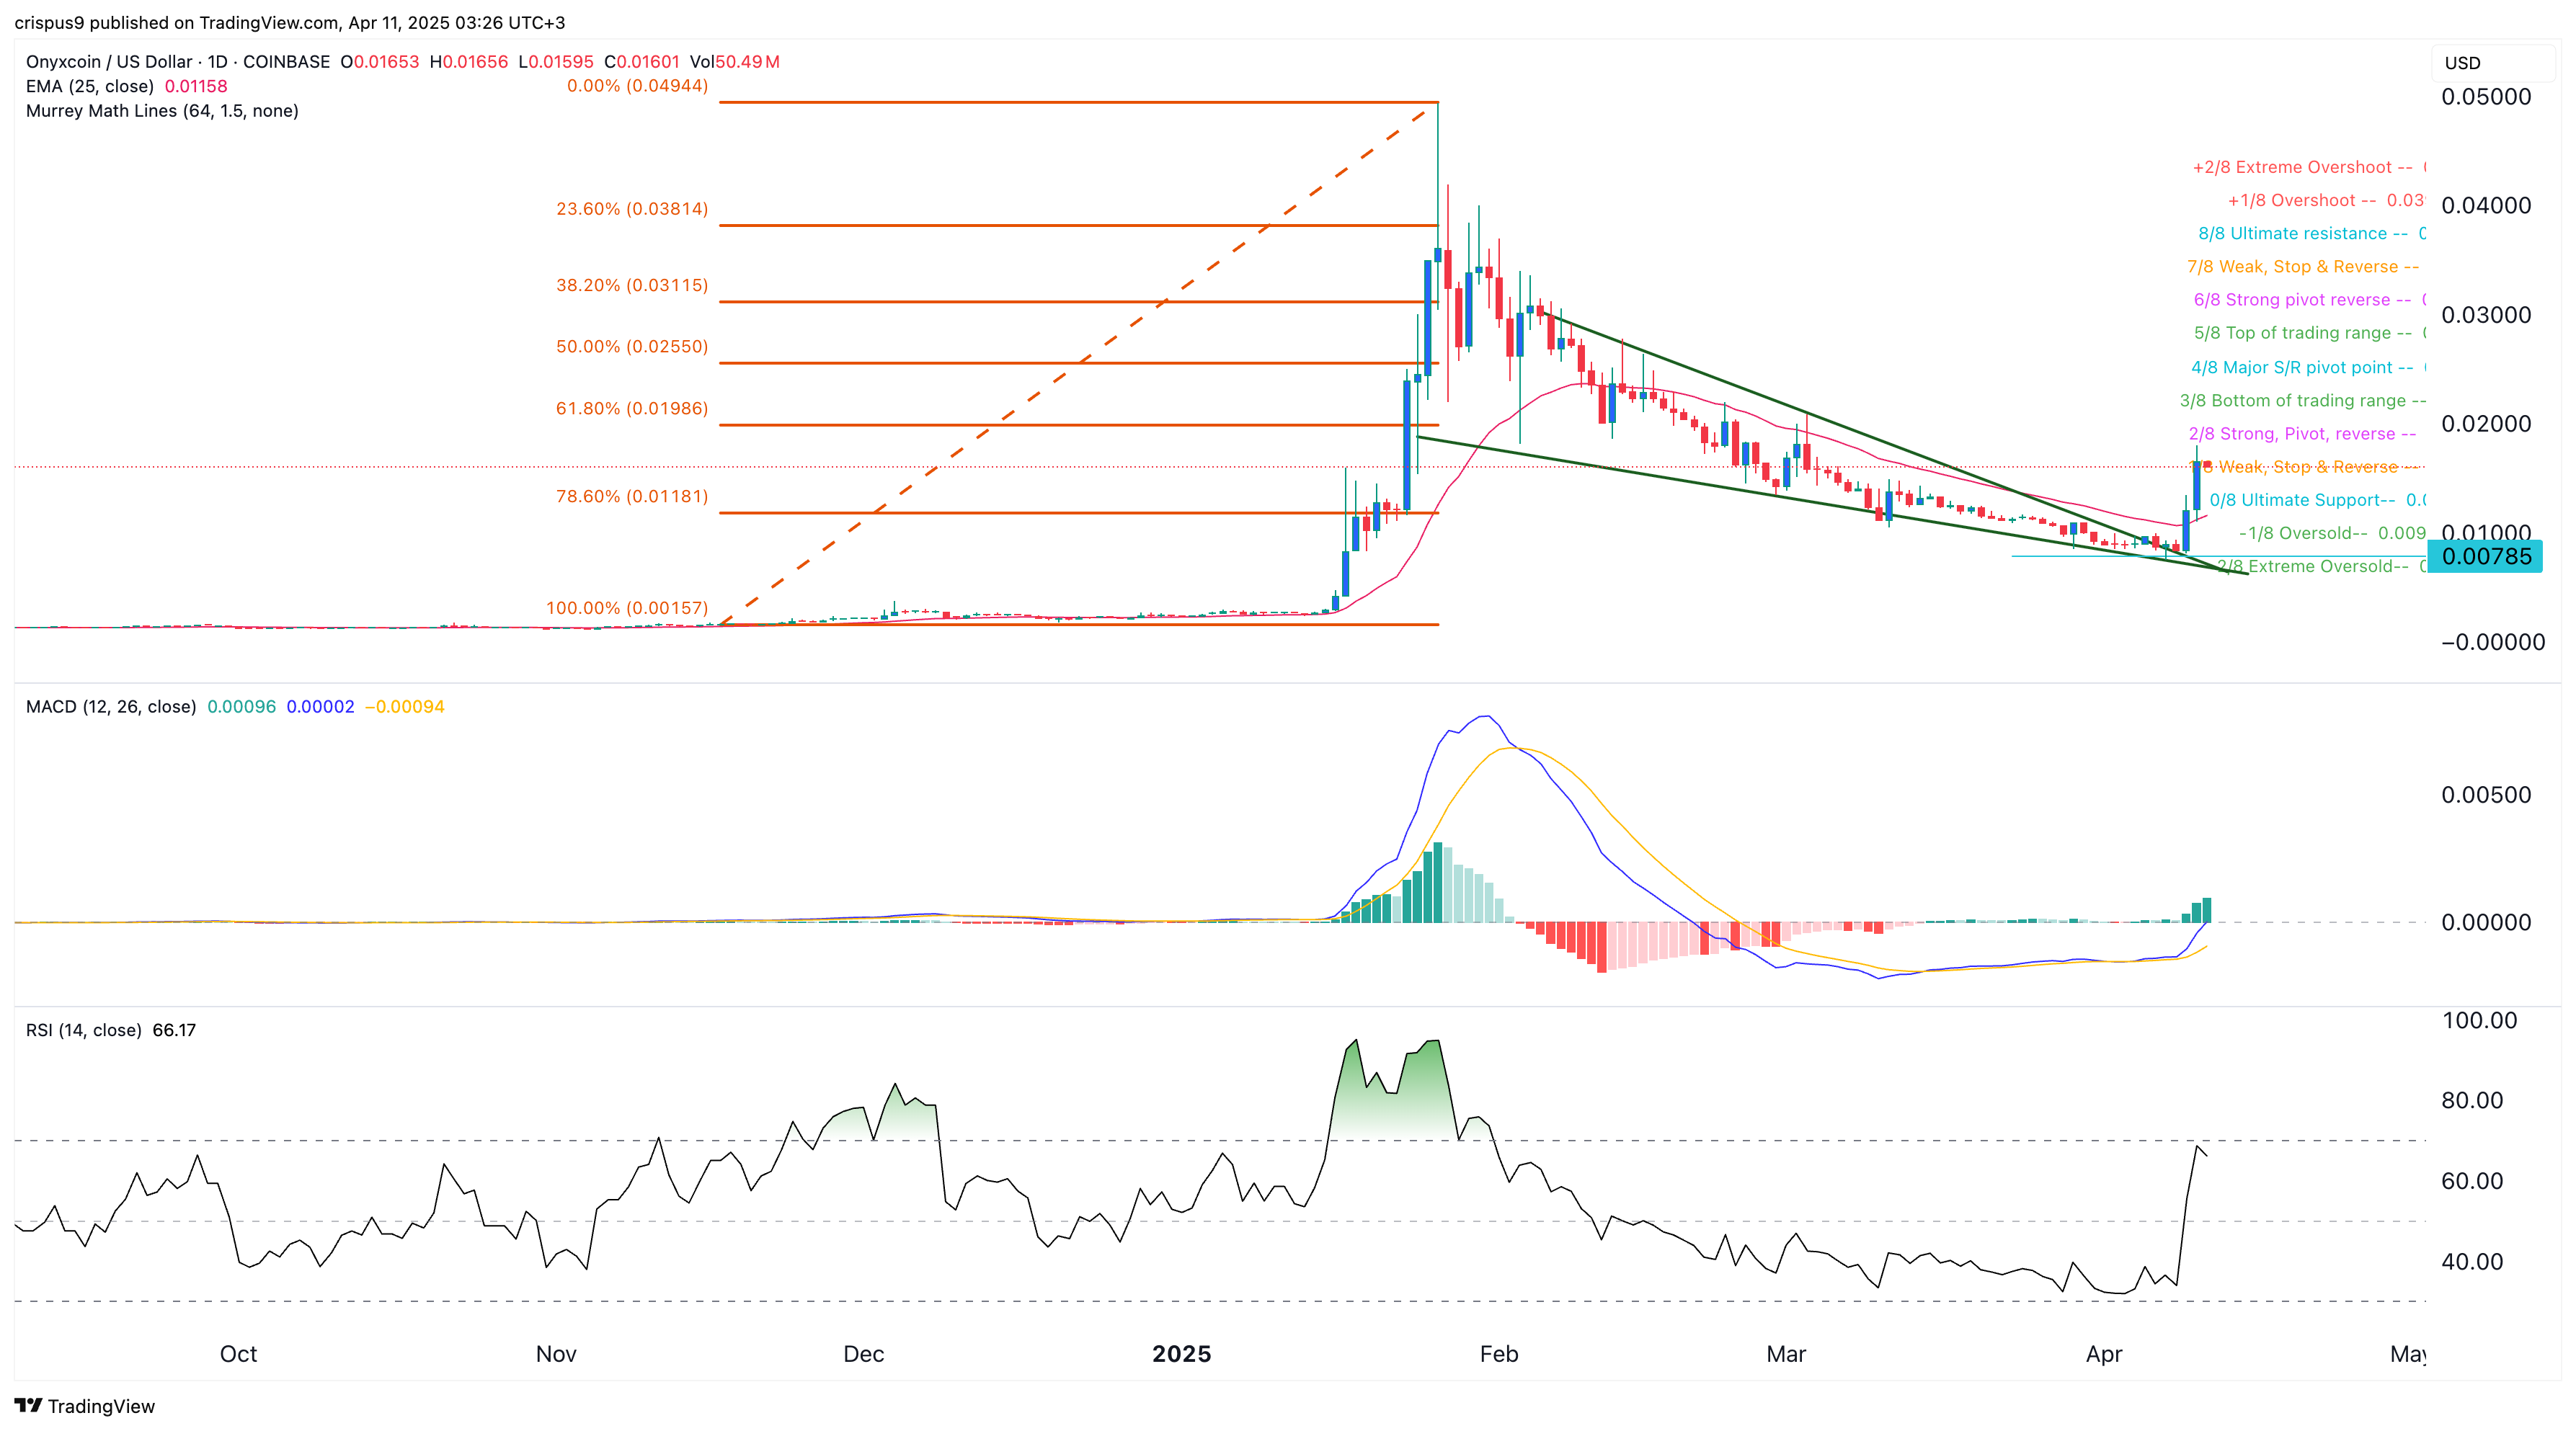
The daily chart shows that the XCN token price has been in a strong downtrend after peaking at $0.05 in February. It bottomed at $0.0078 on April 7, its lowest level since January.
As it dropped, the token formed a giant falling wedge pattern, shown in black. This pattern comprises two falling and converging trendlines. In most cases, this convergence happens when these two lines near their confluence levels, which is what happened with Onyxcoin.
The token has moved above the 50-day and 25-day moving averages and is sitting solidly between the 61.8% and 78.6% Fibonacci Retracement levels. Oscillators like the Relative Strength Index (RSI) and the MACD have also gone parabolic as the token surged.
The XCN price has moved from the oversold point of the Murrey Math Lines to the weak, stop, and reverse level. Therefore, the most likely scenario is where the rally fades and the token pulls back for a while before continuing its rebound. If this happens, it will drop and retest the upper side of the wedge or the 25-day moving average point at $0.01160 and then bounce back.
READ MORE: ‘Watch Out’ – Pepe Coin Price is Primed for a Big Surge This Week
Why the XCN Price Surged
There was no specific reason why the OnyxCoin price surged this week, as there were no headlines. The main bullish aspect was based on technicals as the falling wedge neared its confluence level.
This jump helped to push its futures open interest sharply higher, a sign of robust demand from traders. It soared to a high of $27 million, the highest point since January this year, and much higher than this month’s low of $4.5 million.
However, the main risks for Onyxcoin are its negative funding rates in the futures market and its low DeFi assets. Onyx has a total value locked of just $116,000, while the number of developer commitments has dropped to just 1 in the last two months.
Therefore, these fundamentals also mean that it may resume its downward trend in the near term, as investors take profits.
READ MORE: Ethereum Price Prediction: Crisis Scenario Unfolds, Nears All-Time Low


