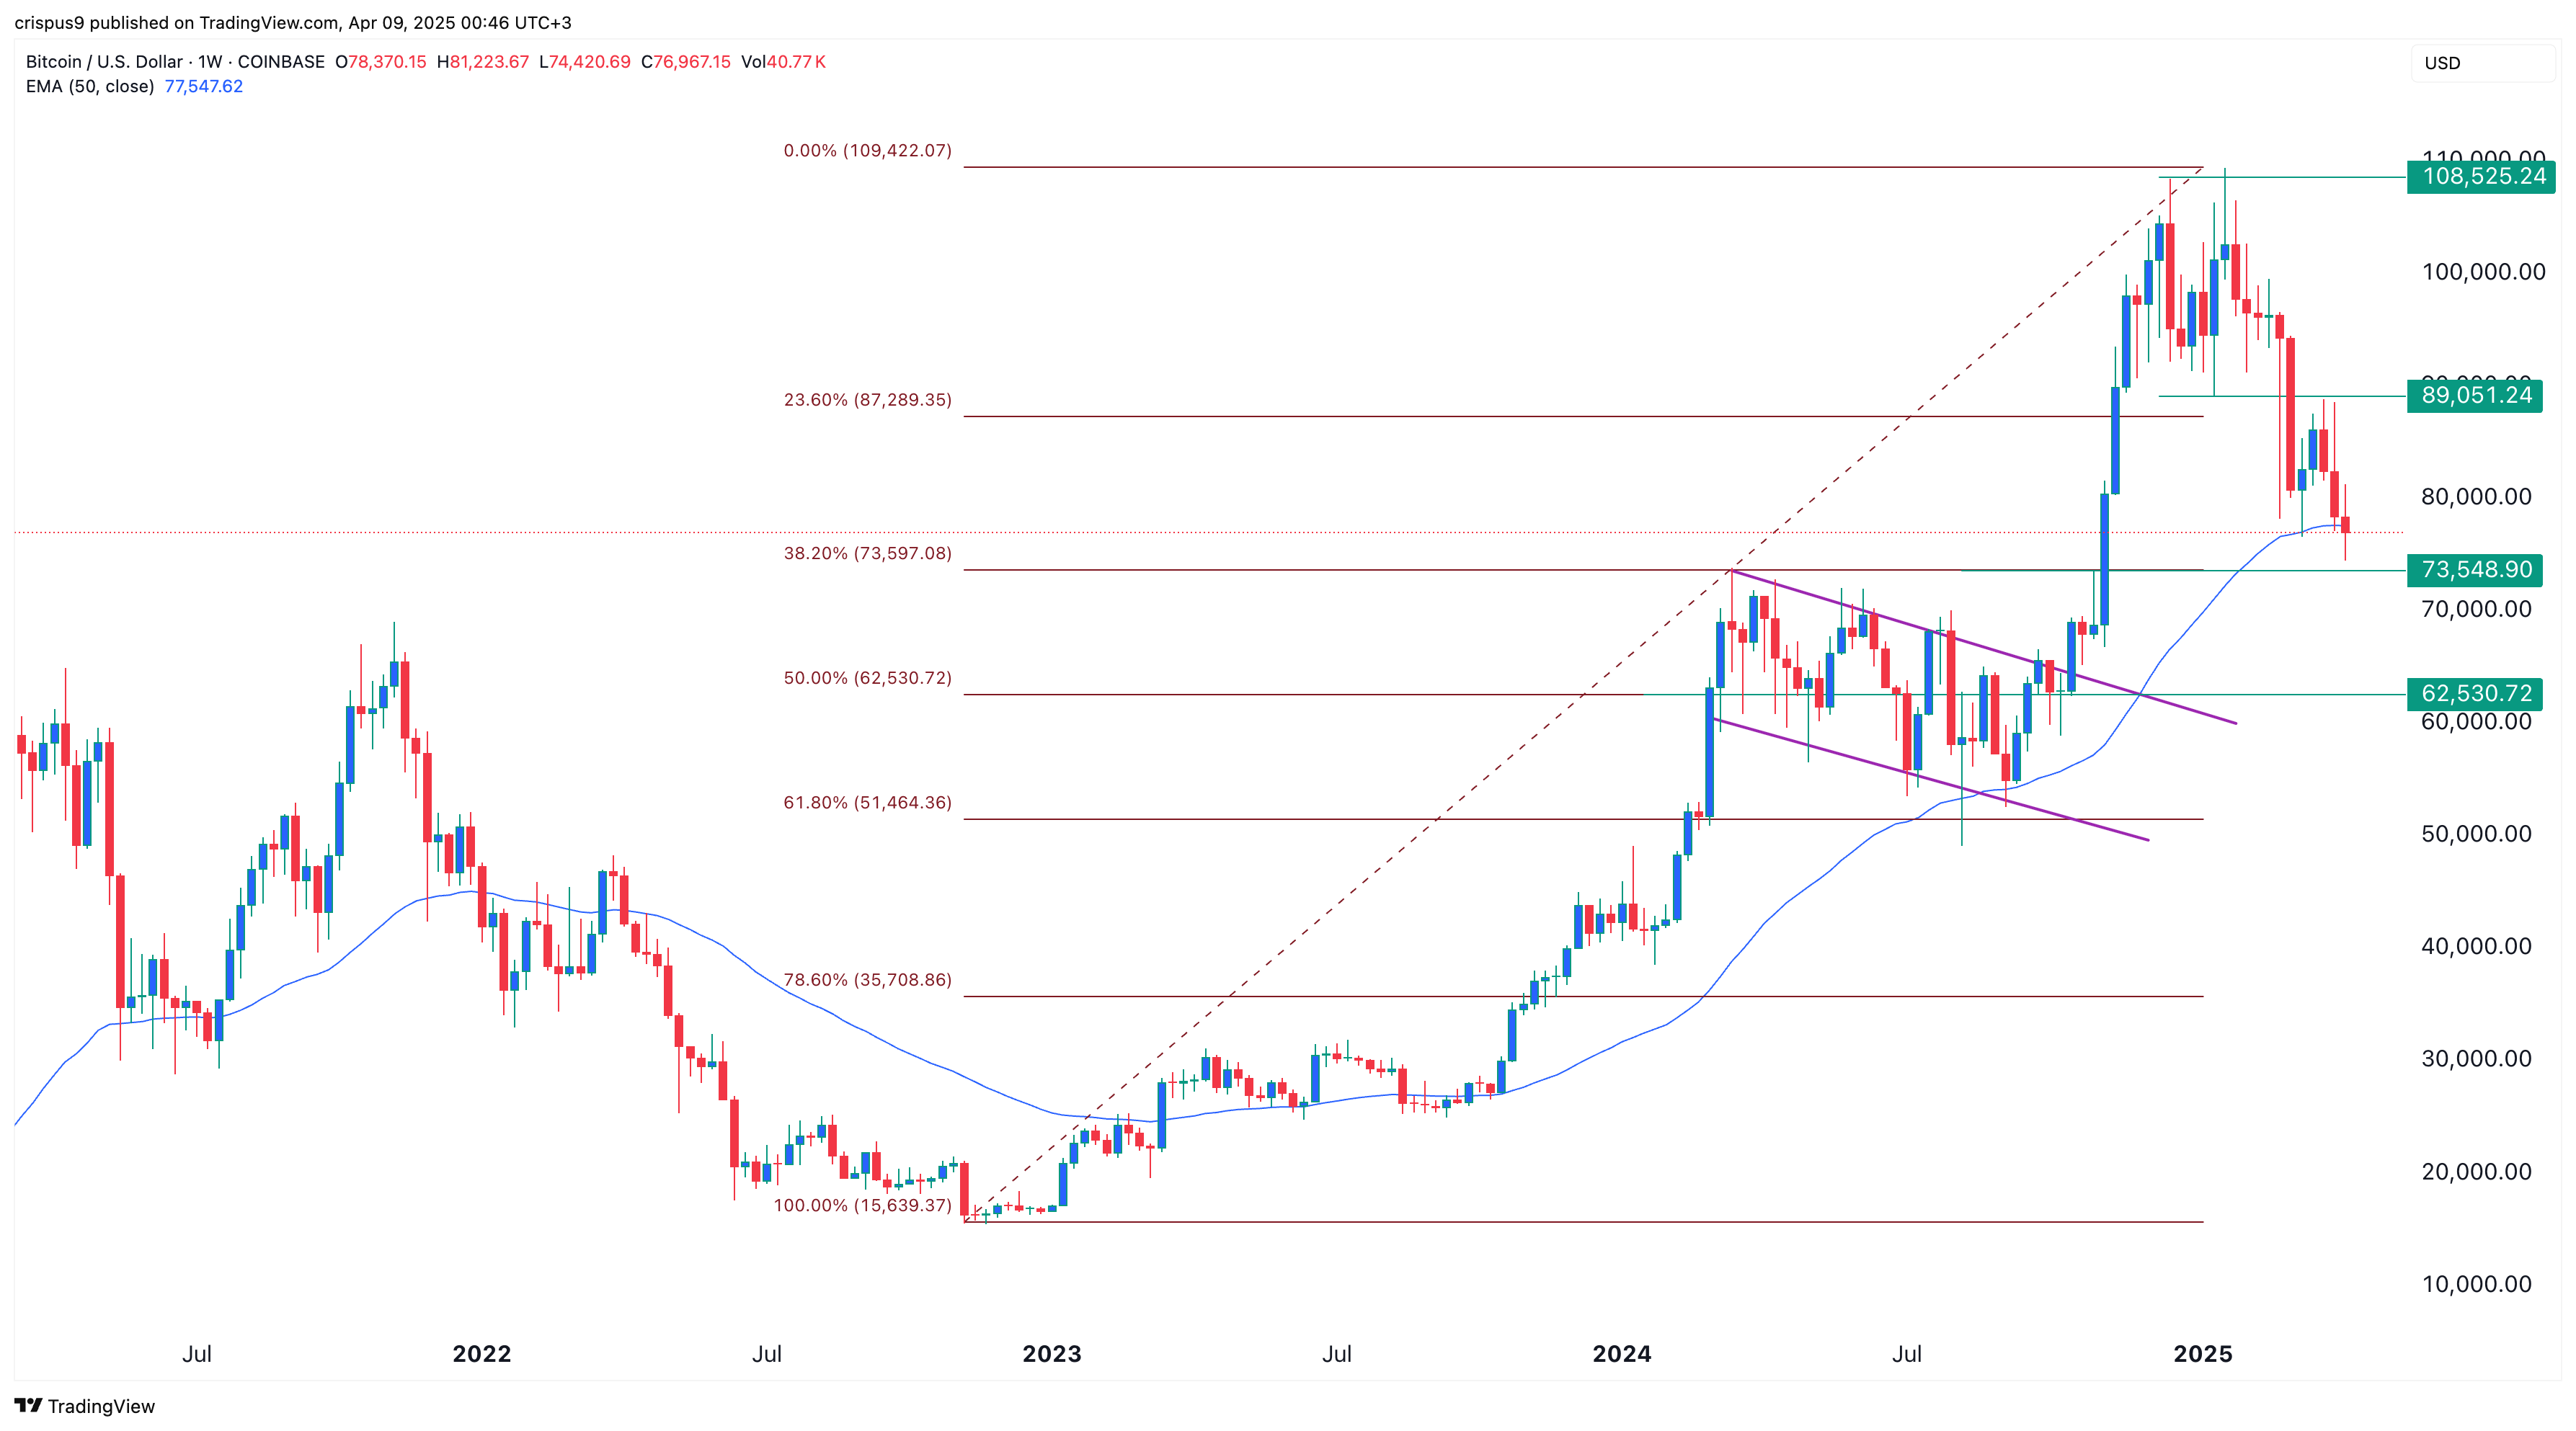
The price of Bitcoin has crashed over the past two months, a trend that may continue in the coming week as global risks rise. BTC dropped to a low of $74,500 on Wednesday, a 32% decline from its yearly high. This article explains why Bitcoin’s price has plunged and the next key targets.
Why Bitcoin Price is Plunging
Bitcoin resumed its downtrend on Wednesday due to concerns about the US and China’s ongoing tensions. The two economic superpowers are on an unsustainable path that may trigger a global recession.
On Tuesday, China vowed to fight against measures implemented by Donald Trump. Hours later, Trump announced that the US would hike tariffs on all Chinese goods brought to the country by 50%. The measure, effective Wednesday, pushed tariffs on all Chinese goods up to 104%.
China has vowed to fight back. This implies that Beijing may announce its countermeasures soon. Therefore, analysts believe this trade war is a black swan event that may trigger a recession or even a depression.
This explains why fear has spread in the financial market this month. The crypto fear and greed index has moved to 24, while the CNN Money gauge has retreated to 5. Investors often stay on the sidelines when the fear and greed index is falling. Data shows that Bitcoin ETFs have shed assets in the last four consecutive days, a trend that may continue for a while.
READ MORE: Polkadot Price Nears Surge: Staking Inflows and Yields Soar
BTC Price Technical Analysis

The weekly chart shows that Bitcoin has been in a strong downtrend over the past few months. The price dropped after the coin formed a double-top pattern at $108,520. On March 3, it fell below the pattern’s neckline at $89,050.
Bitcoin has moved below the 23.60% Fibonacci Retracement level and the 50-week Exponential Moving Average (EMA), a victory for bears. Therefore, technical analyses suggest that the coin will continue falling as sellers target the next key support level at $73,550.
This target is notable for two reasons: It corresponds to the upper side of the handle section of the C&H pattern. Dropping to this level may signal a break-and-retest, a popular bullish continuation sign. It also aligns with the 38.2% Fibonacci Retracement level.
A break below that support level will indicate more Bitcoin price crashes to the 50% retracement point at $62,530, which is down by 19% below the current level. The bearish outlook will be nullified if Bitcoin rises above $87,000.
READ MORE: “It’s a Game of Chicken” – EOS, NEAR, Sonic, SHIB Plunge as VIX Index Surges


