


Ethereum price has continued its strong downward trend as the crypto fear and greed index slumps. ETH has dropped for two consecutive weeks, reaching a low of $1,645, its lowest level since October. It has slumped by over 60% from its highest level in December last year.
Ethereum Price Technical Analysis
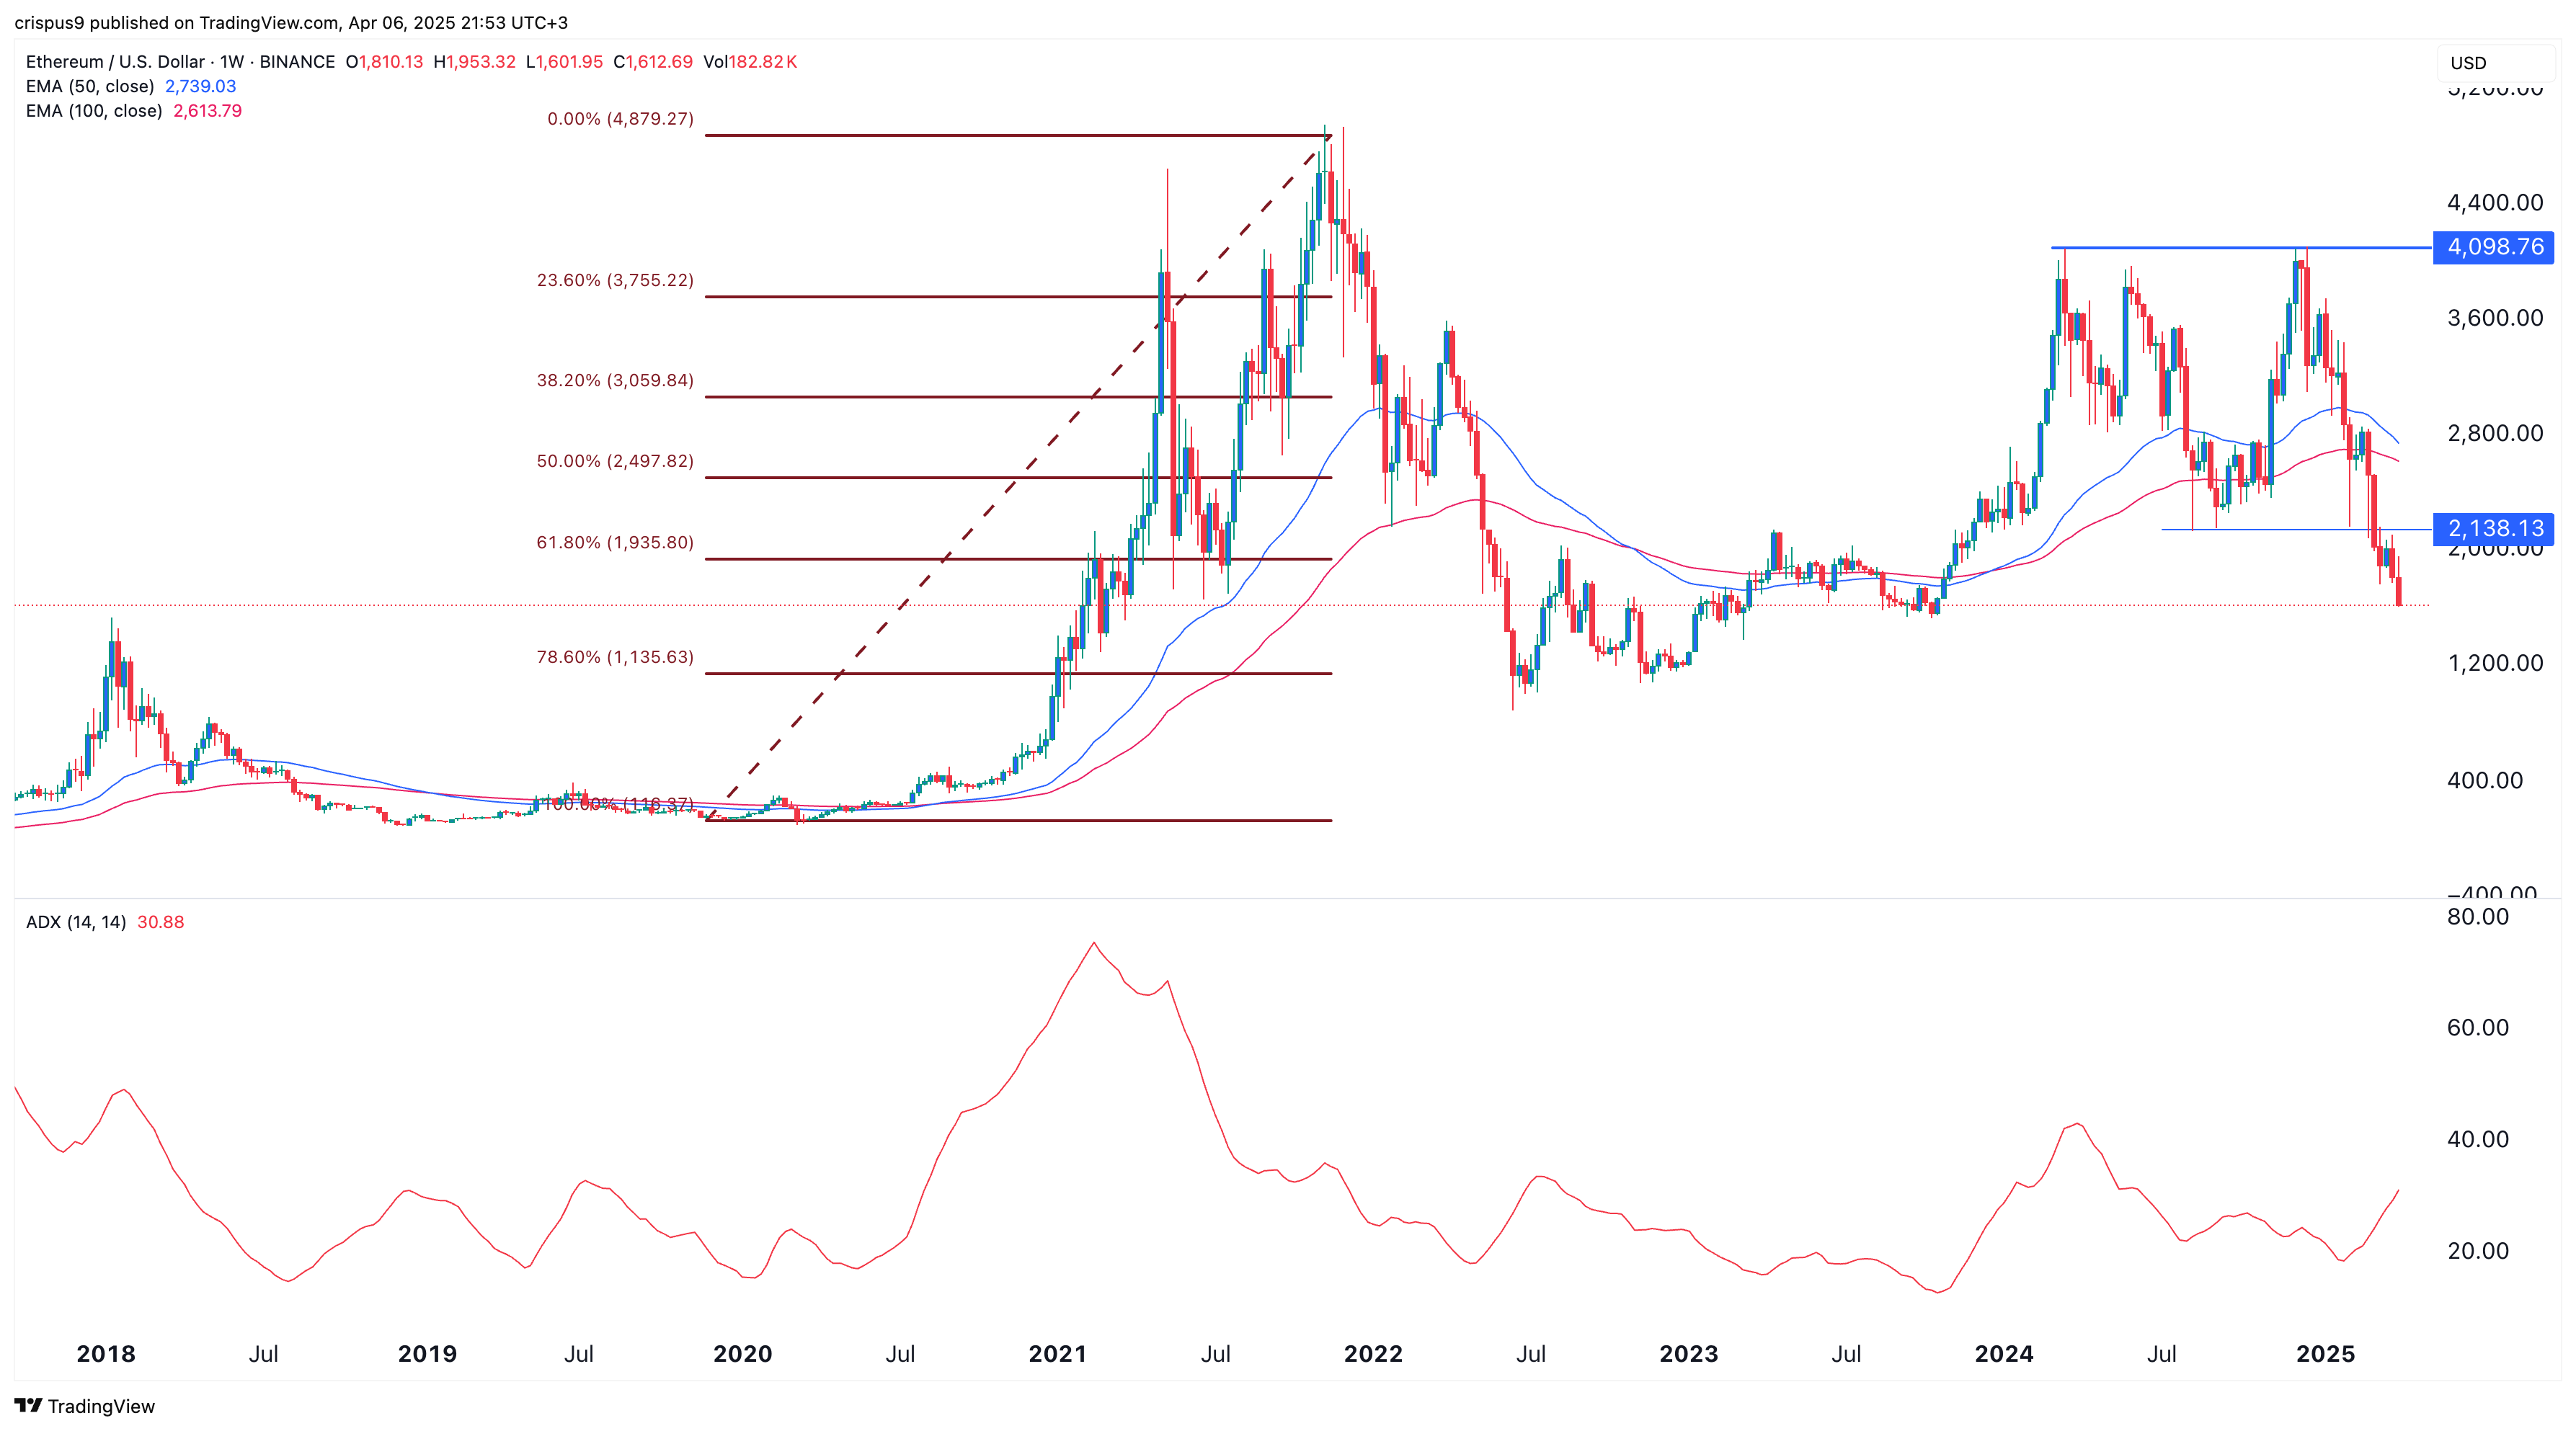
The weekly chart shows how low the ETH price has plummeted. After peaking at $4,098 in December, the altcoin has lost more than 60% of its value, erasing billions of dollars in value.
The token formed a triple-top pattern at $4,098, a popular bearish sign comprised of three peaks and a neckline at $2,140. Ether has already moved below that neckline, indicating that bears have prevailed.
Ethereum price has also plunged below the 61.8% Fibonacci Retracement level at $1,935. This is notable because this Fibonacci level is widely known as the ‘golden ratio,’ where most pullbacks occur.
Ether has also moved below the 50-week and 100-week Exponential Moving Averages (EMA). Additionally, the Relative Strength Index (RSI) and the Stochastic Oscillator are both pointing downwards.
The closely-watched Average Directional Index (ADX) has jumped to 30 and is pointing upwards. The ADX is a common indicator that measures trend strength; a figure above 20 indicates a strengthening trend.
Therefore, Ethereum’s price is likely headed for a bearish breakdown in the coming days, with crucial support levels at $1,500 and $1,000.
The bearish ETH price forecast will be invalidated if the coin rebounds to retest the crucial resistance level at $2,138.
Fear and Greed Index is Crashing
The bearish ETH price outlook has become more pronounced as investors have recently grown more fearful.
CoinMarketCap data shows that the crypto fear and greed index has entered the fear zone at 27. The altcoin season index has dropped to 16, indicating that investors are favoring Bitcoin over altcoins.
Most notably, the stock market fear and greed index has fallen to the extreme fear zone of 4, its lowest point since 2020. When this happens, investors often remain on the sidelines, which explains why spot ETH ETFs have continued to see outflows. They shed almost $50 million last week, up from $8.65 million a week earlier.
This week, macro factors such as the ongoing trade war will be key drivers for Ethereum prices. There are signs that this trade war will accelerate after Donald Trump remains adamant that his tariff strategy will work out.
READ MORE: Crypto Chart of the Week: Solana Price Sits at a Make-or-Break Point