


Solana price has dropped to a key support level that could determine its next trajectory. After soaring to nearly $300 in January, the SOL token plunged to a low of $113 and risks further downside if it loses a critical support area. This price action makes SOL the chart of the week, as its breakdown may have major implications for its meme coin ecosystem.
Solana Price Is Our Chart of the Week
Solana, the second-biggest layer-1 network in the crypto industry, sits at a critical make-or-break level. The coin remains at a key level on the daily chart for three reasons.
First, it is hovering at the 61.8% Fibonacci Retracement level, known as the golden ratio, where most rebounds happen. A complete move below that level is a sign that bears have prevailed.
Second, the price is along the small double-bottom point at $114. A double bottom is a popular bullish reversal sign in technical analysis. In this case, it comprises two troughs and a neckline at $147.18.
Third, the SOL price has failed to move below this level several times over the past year, meaning that shorts have been afraid to place bids below that level.
Worse, Solana formed a death cross pattern on March 3 as the 50-day and 200-day Exponential Moving Averages (EMAs) crossed each other. Therefore, these factors indicate a further downside if Solana loses this critical support level.
READ MORE: Bitcoin Price Prediction as Crude Oil, US Bond Yield Crash
SOL Price Targets
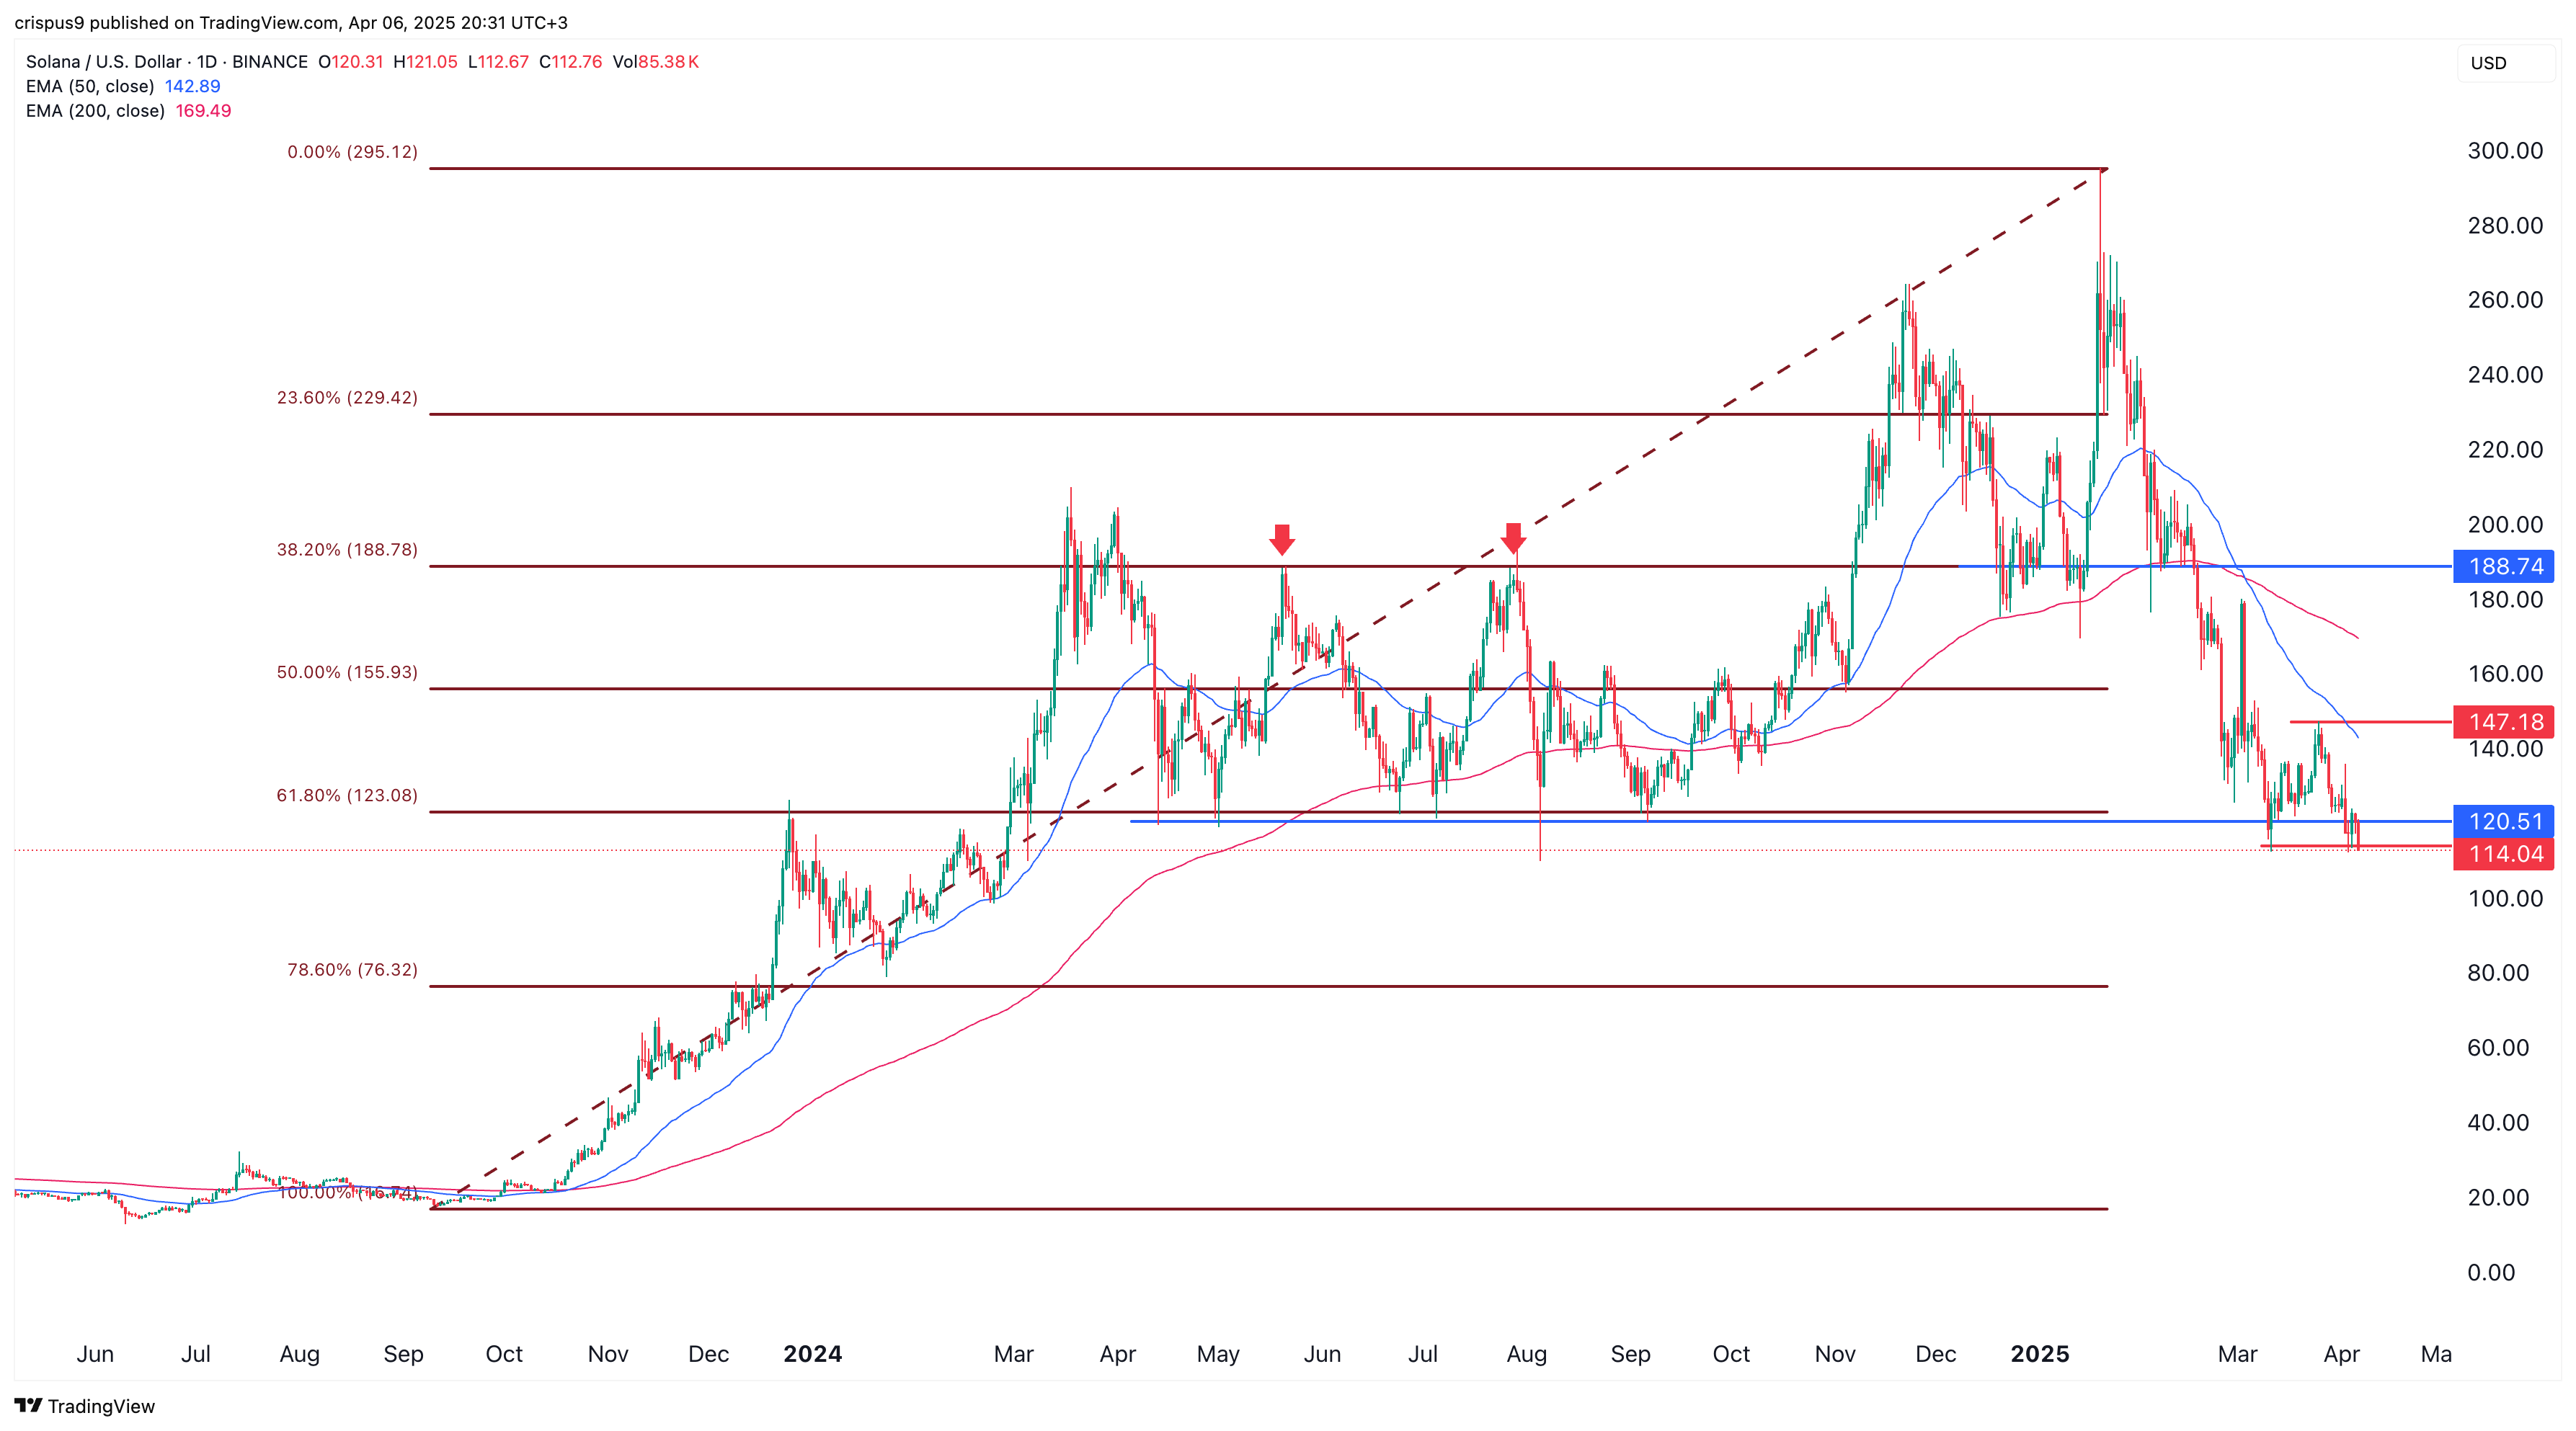
A strong bearish breakdown below this price will point to more downside, potentially reaching the 78.6% retracement level at $76.32. Such a bearish breakdown would represent a 32% drop from the current level.
On the flip side, a move above the double bottom’s neckline at $147.18 will invalidate the bearish outlook. Such a move would lead to more upside. The next point to watch is the 38.2% retracement level at $188, followed by the psychological point at $200. $188 is important since it was the highest point in May and July last year.
The potential catalysts for the Solana price will be the financial market’s performance on Monday due to the ongoing trade tensions between the US and China. The market will also react moderately to the Federal Reserve minutes scheduled for Wednesday and the US inflation data on Thursday.
READ MORE: EOS Price Prediction: How High Can the Future Vaulta Token Go?