


Cryptocurrency prices continue to be under pressure this week as the market stays cautious about recession risks due to Donald Trump’s tariffs. Bitcoin price remains below $90,000, while the crypto fear and greed index plunges to the extreme fear zone. So, what’s next for popular cryptocurrencies like IOTA, Hedera Hashgraph (HBAR), and Floki?
IOTA Price Analysis
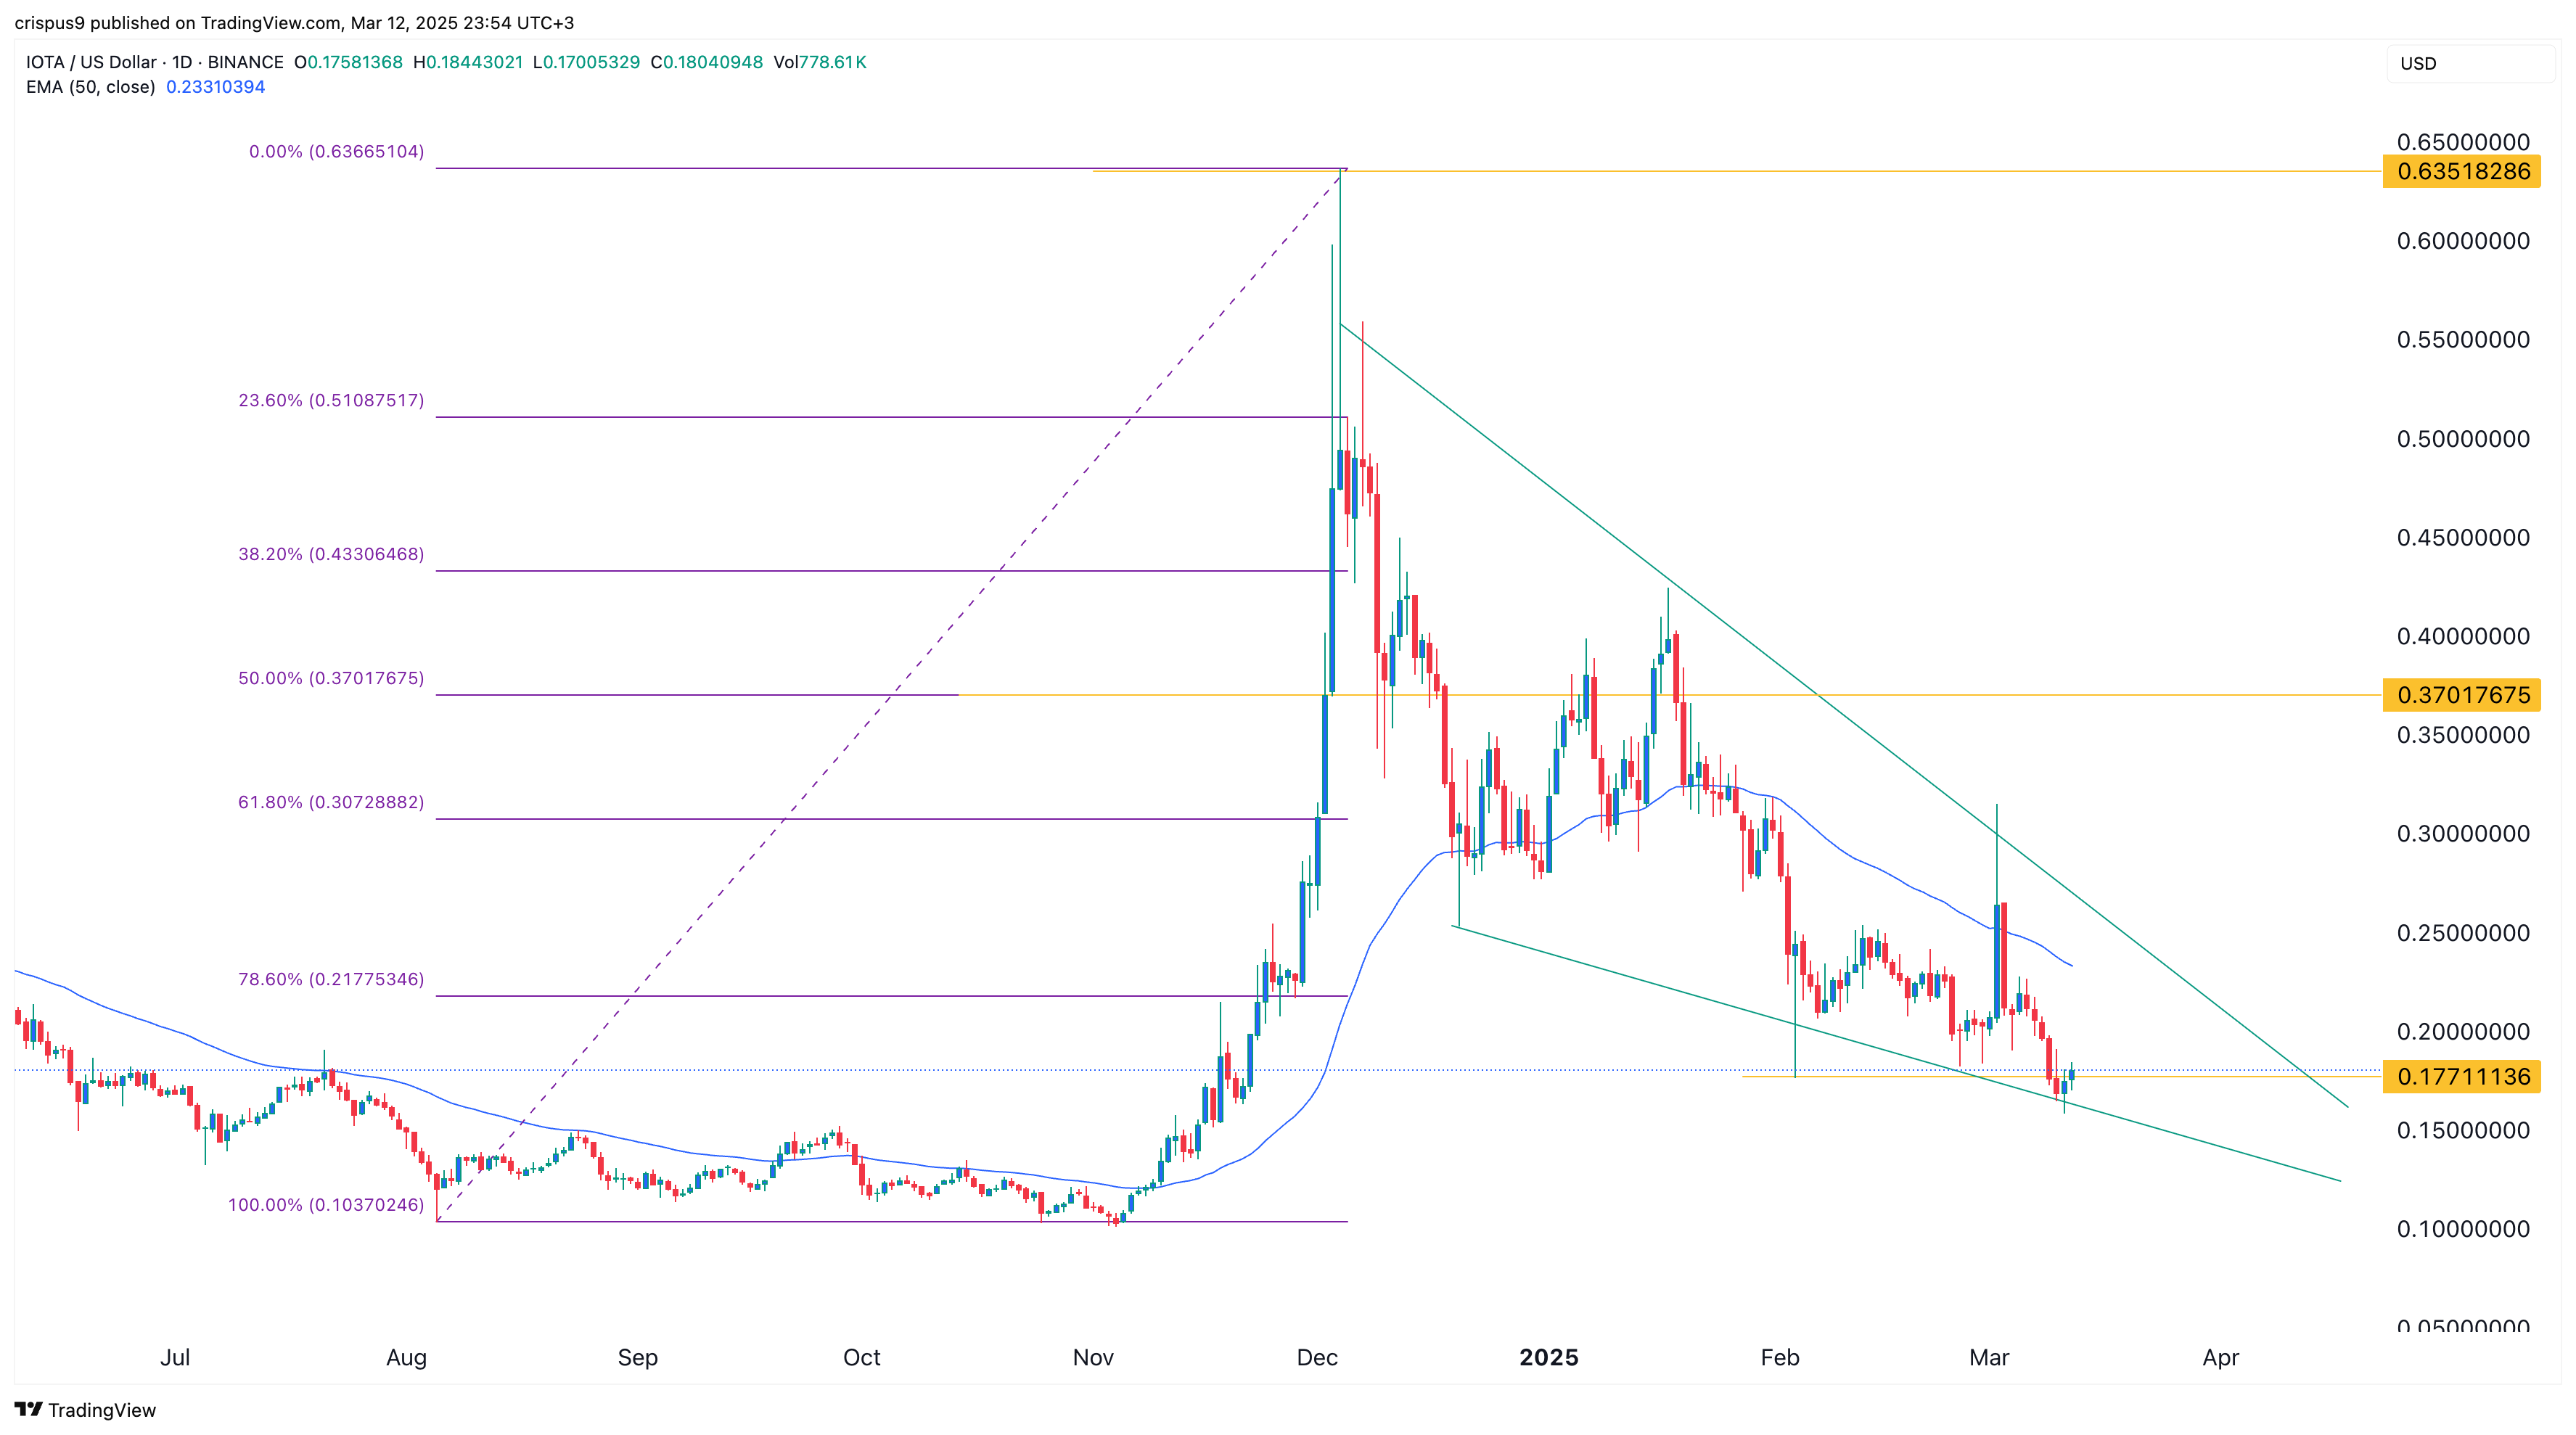
The IOTA token has been experiencing a steep downward trend over the past few months. It dropped from a high of $0.6350 on December 4 and then retreated by over 77% to the current $0.1800.
The coin has dropped even as the market awaits the upcoming IOTA rebased upgrade. This upgrade will be important and introduce numerous features to the network, such as staking and Ethereum Virtual Machine (EVM). While no date has been set for this upgrade, indications suggest it may occur this month or in Q2.
The daily chart shows that IOTA price has crashed below the 78.6% Fibonacci Retracement level at $0.2177. It has also stayed below the 50-day and 100-day moving averages, indicating that bears remain in control.
On the positive side, the IOTA coin has found strong support at $0.1771, where it formed a double-bottom pattern and a falling wedge pattern. Therefore, although the downward trend may persist, there is a chance it could bounce back and possibly retest the 50% retracement level at $0.370.
Floki Price Forecast
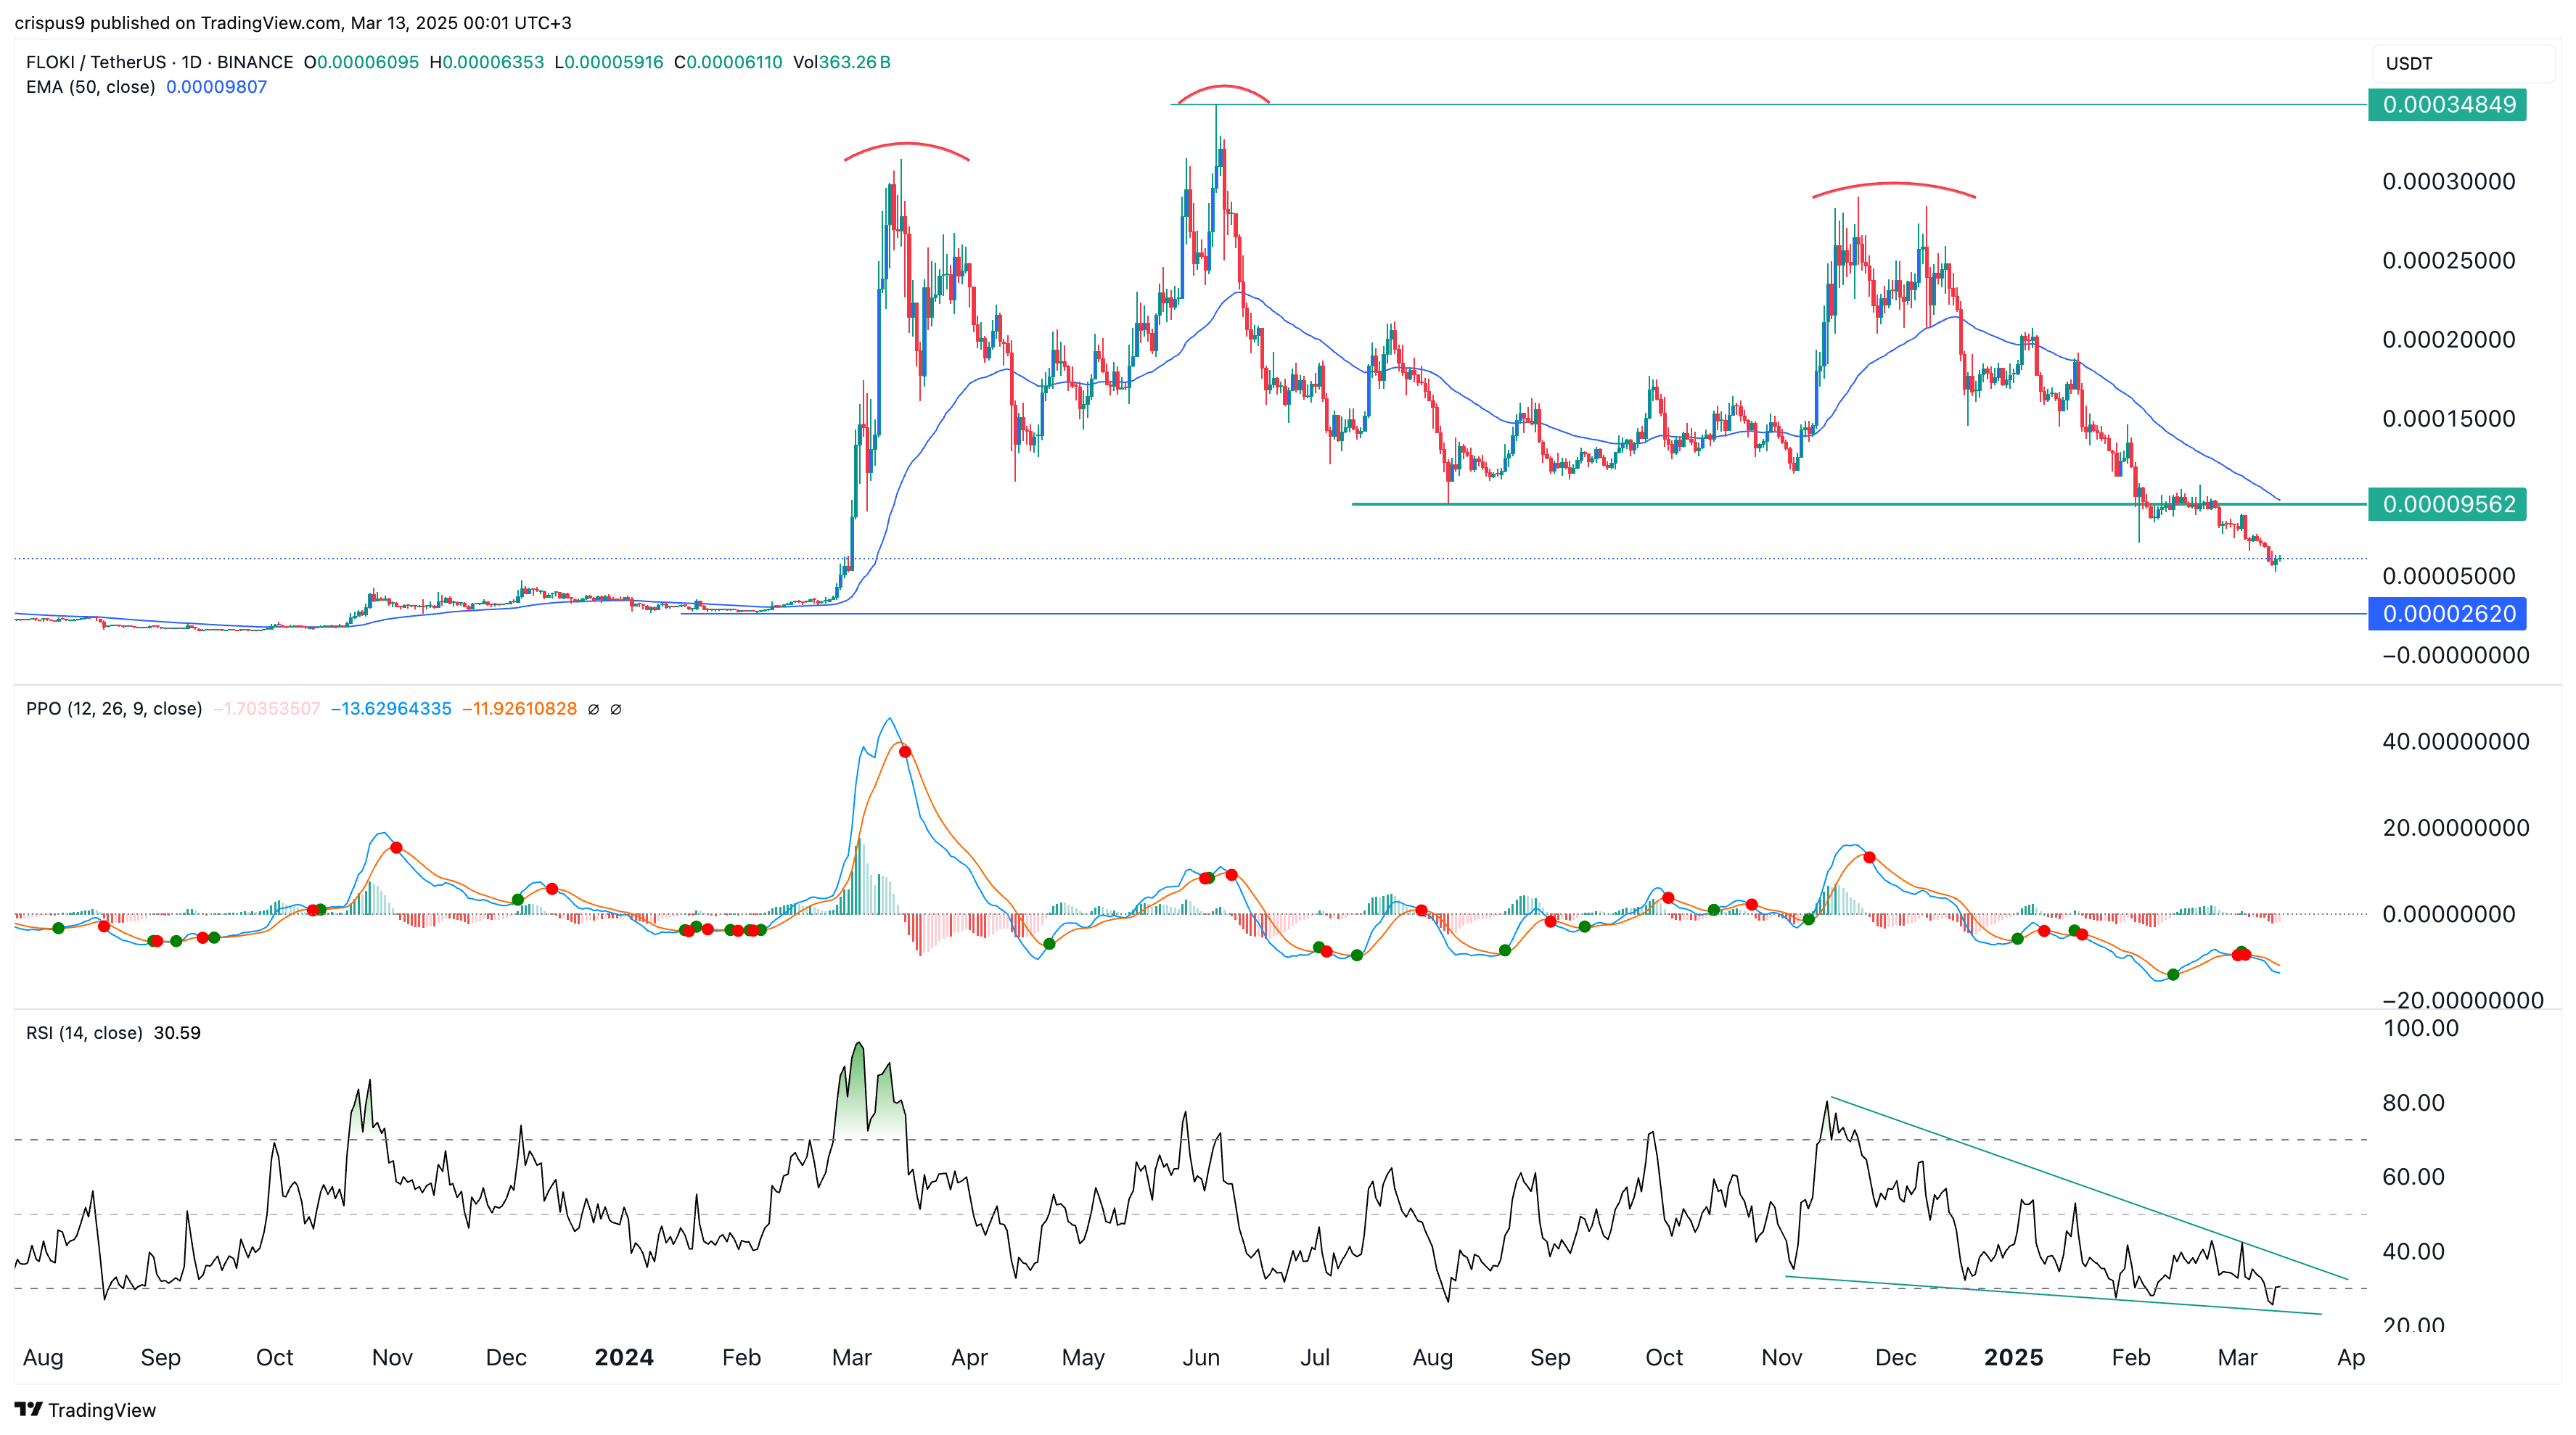
Floki Price Chart | Source: TradingView
Floki, a highly popular meme coin, started its strong freefall after peaking at $0.0003485, its highest level in June last year. It formed a head and shoulders pattern and has now moved below the neckline at $0.00009562, its lowest level in August last year.
The coin has dropped below the 50-day moving average, while the MACD indicator has dropped below the zero line. Further, the Relative Strength Index (RSI) has formed a descending triangle pattern and has moved to the oversold level.
Therefore, Floki’s outlook is bearish. The next level to watch is $0.00002620, its lowest level in February last year. A move above the resistance level at $0.00009562 will invalidate the bullish outlook.
Hedera Price Forecast
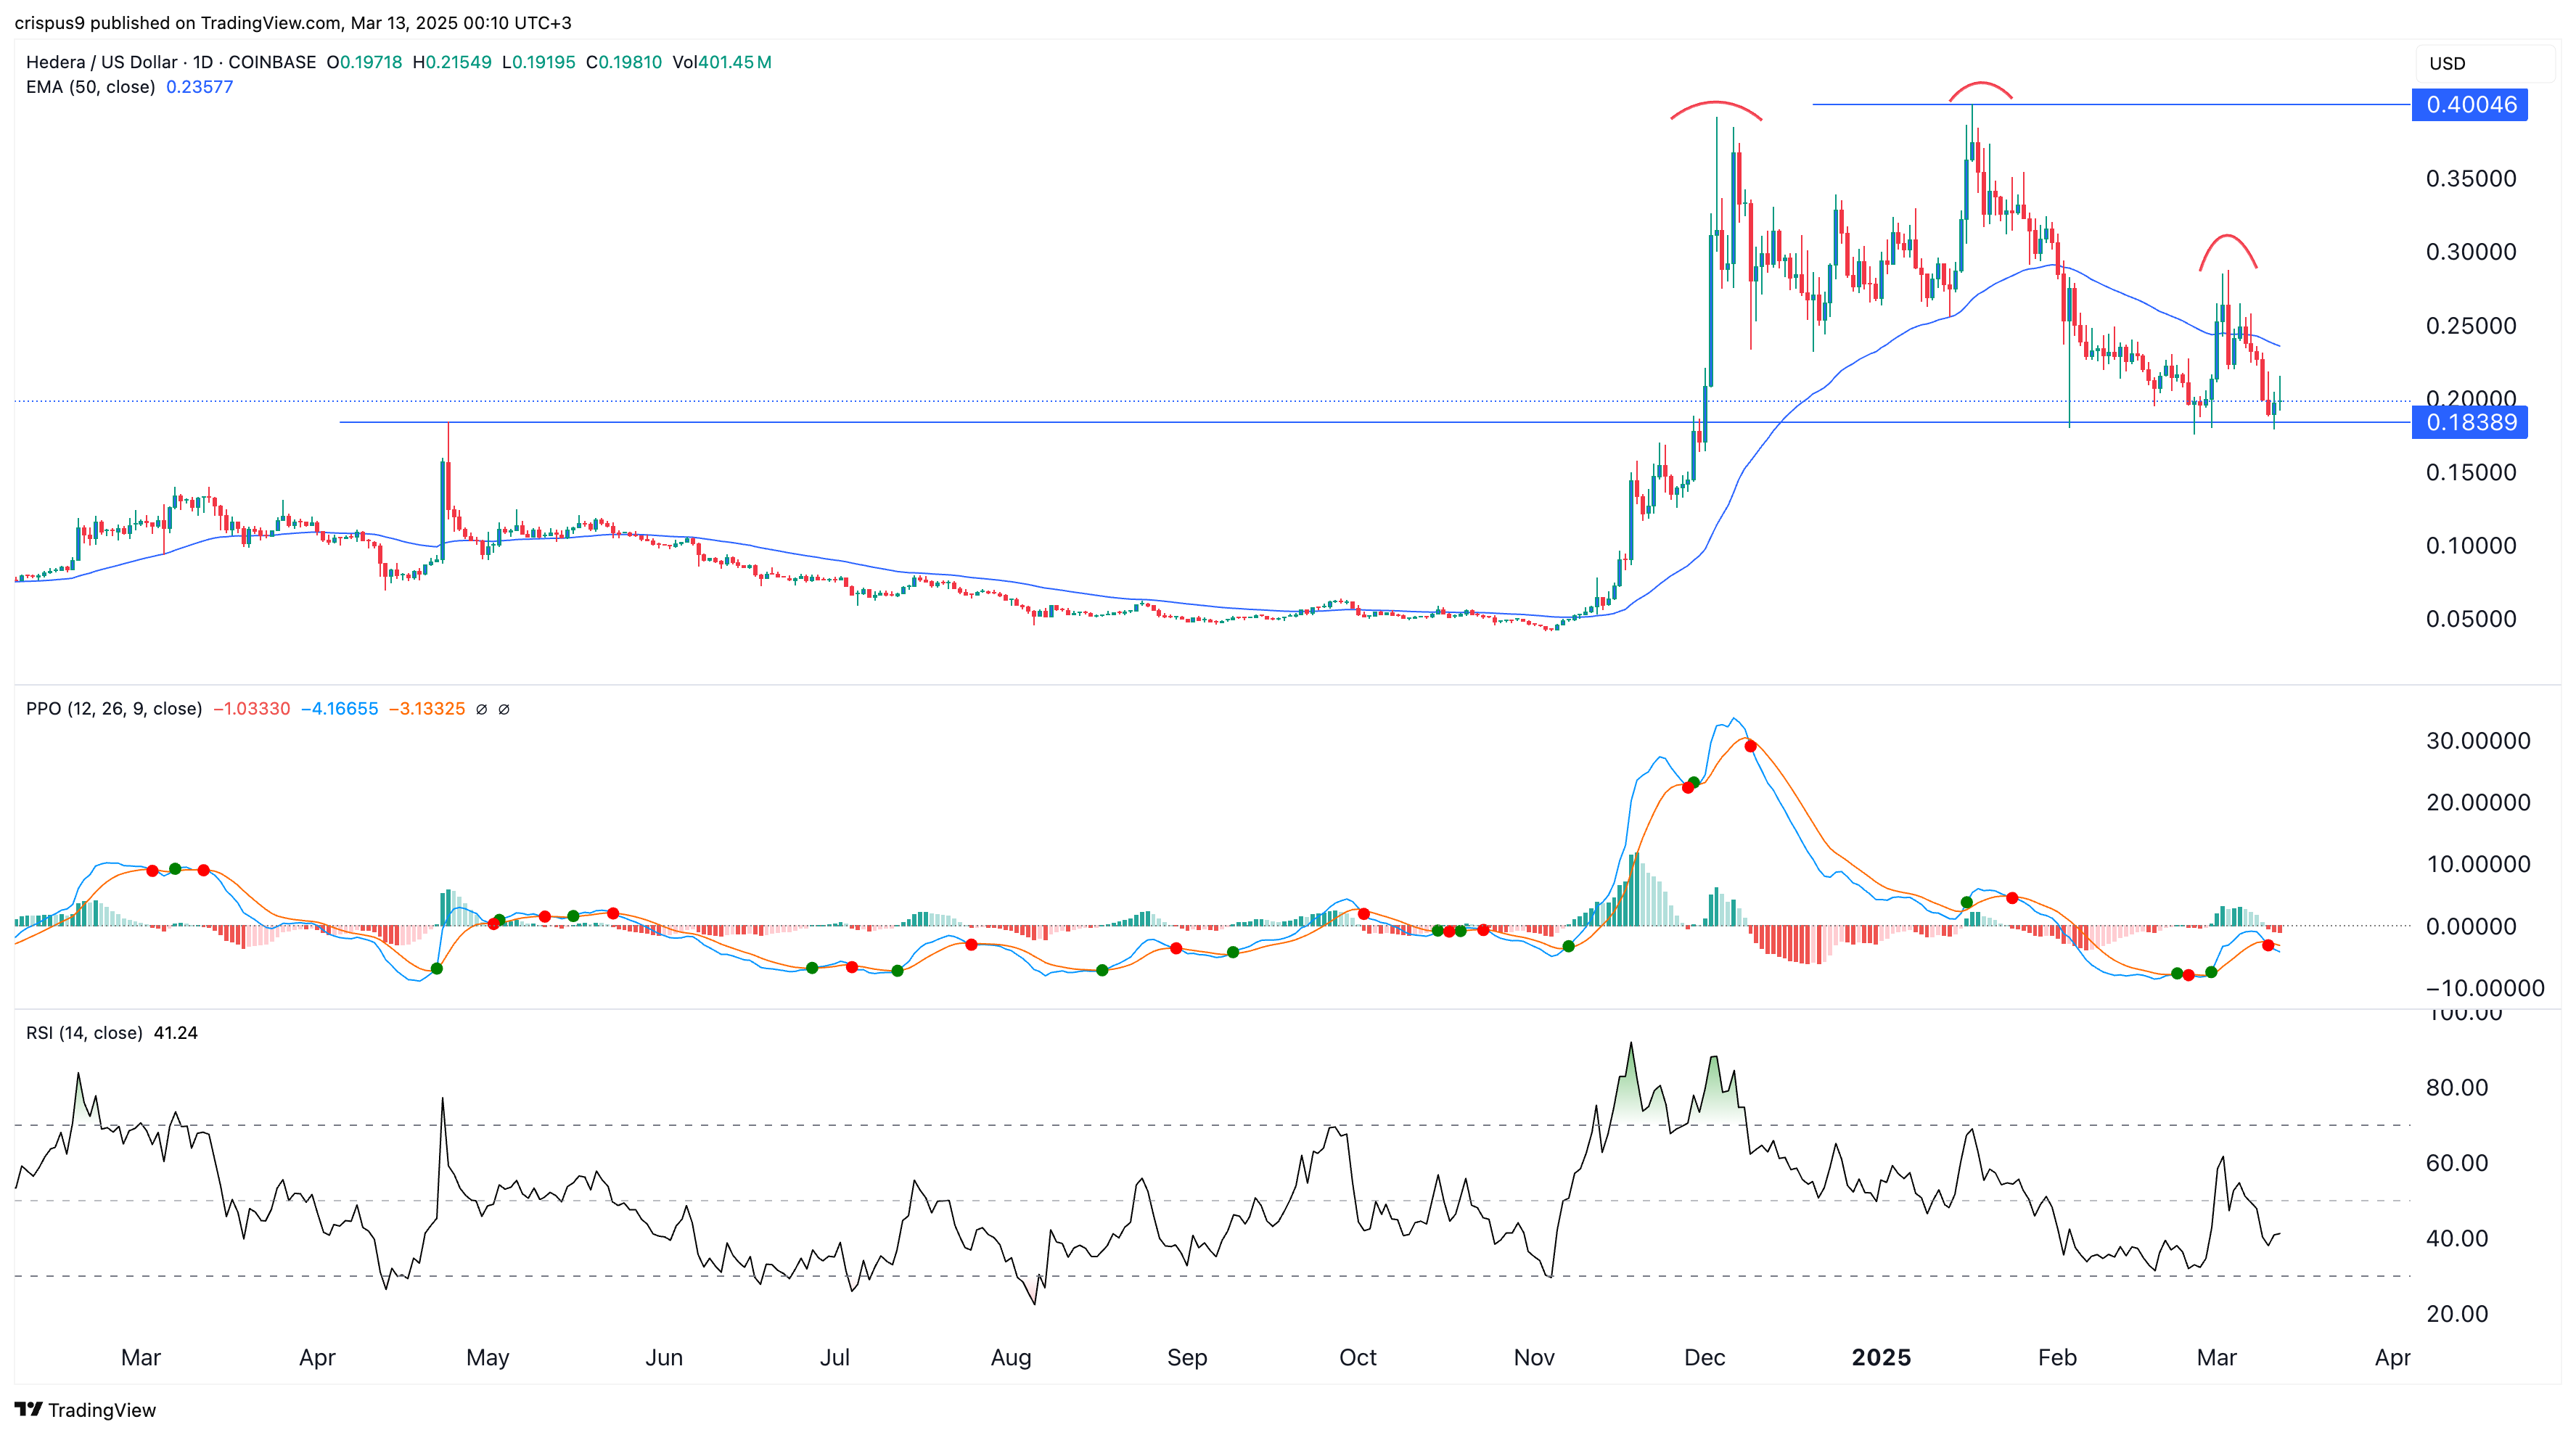
The Hedera Hashgraph price has retreated to crucial support at $0.1840, which it has failed to move below since February. This support also represents the neckline of a head-and-shoulders pattern and was the highest swing in April last year.
Hedera has also dropped below the 50-day moving average, signaling that bears are in control for now. Therefore, a break below the support at $0.1838 will point to more downside, with the next level to watch being the psychological point at $0.1500.
Hedera Hashgraph has several bullish catalysts, including increasing odds that the SEC will approve a spot HBAR ETF. It will also benefit from the upcoming partnership with SWIFT.
READ MORE: Franklin Templeton Files for Solana ETF – Will it Outperform ETH?