


Crypto prices have remained under pressure in the past few months, but the coming days will be crucial. The US will publish the latest consumer price index (CPI) data on Wednesday. A Lunar Eclipse is set to occur on March 13-14, and the Federal Reserve is scheduled to meet on March 18. This crypto price prediction looks at Ethereum (ETH), Ripple (XRP), and Dogecoin (DOGE).
XRP Price Prediction
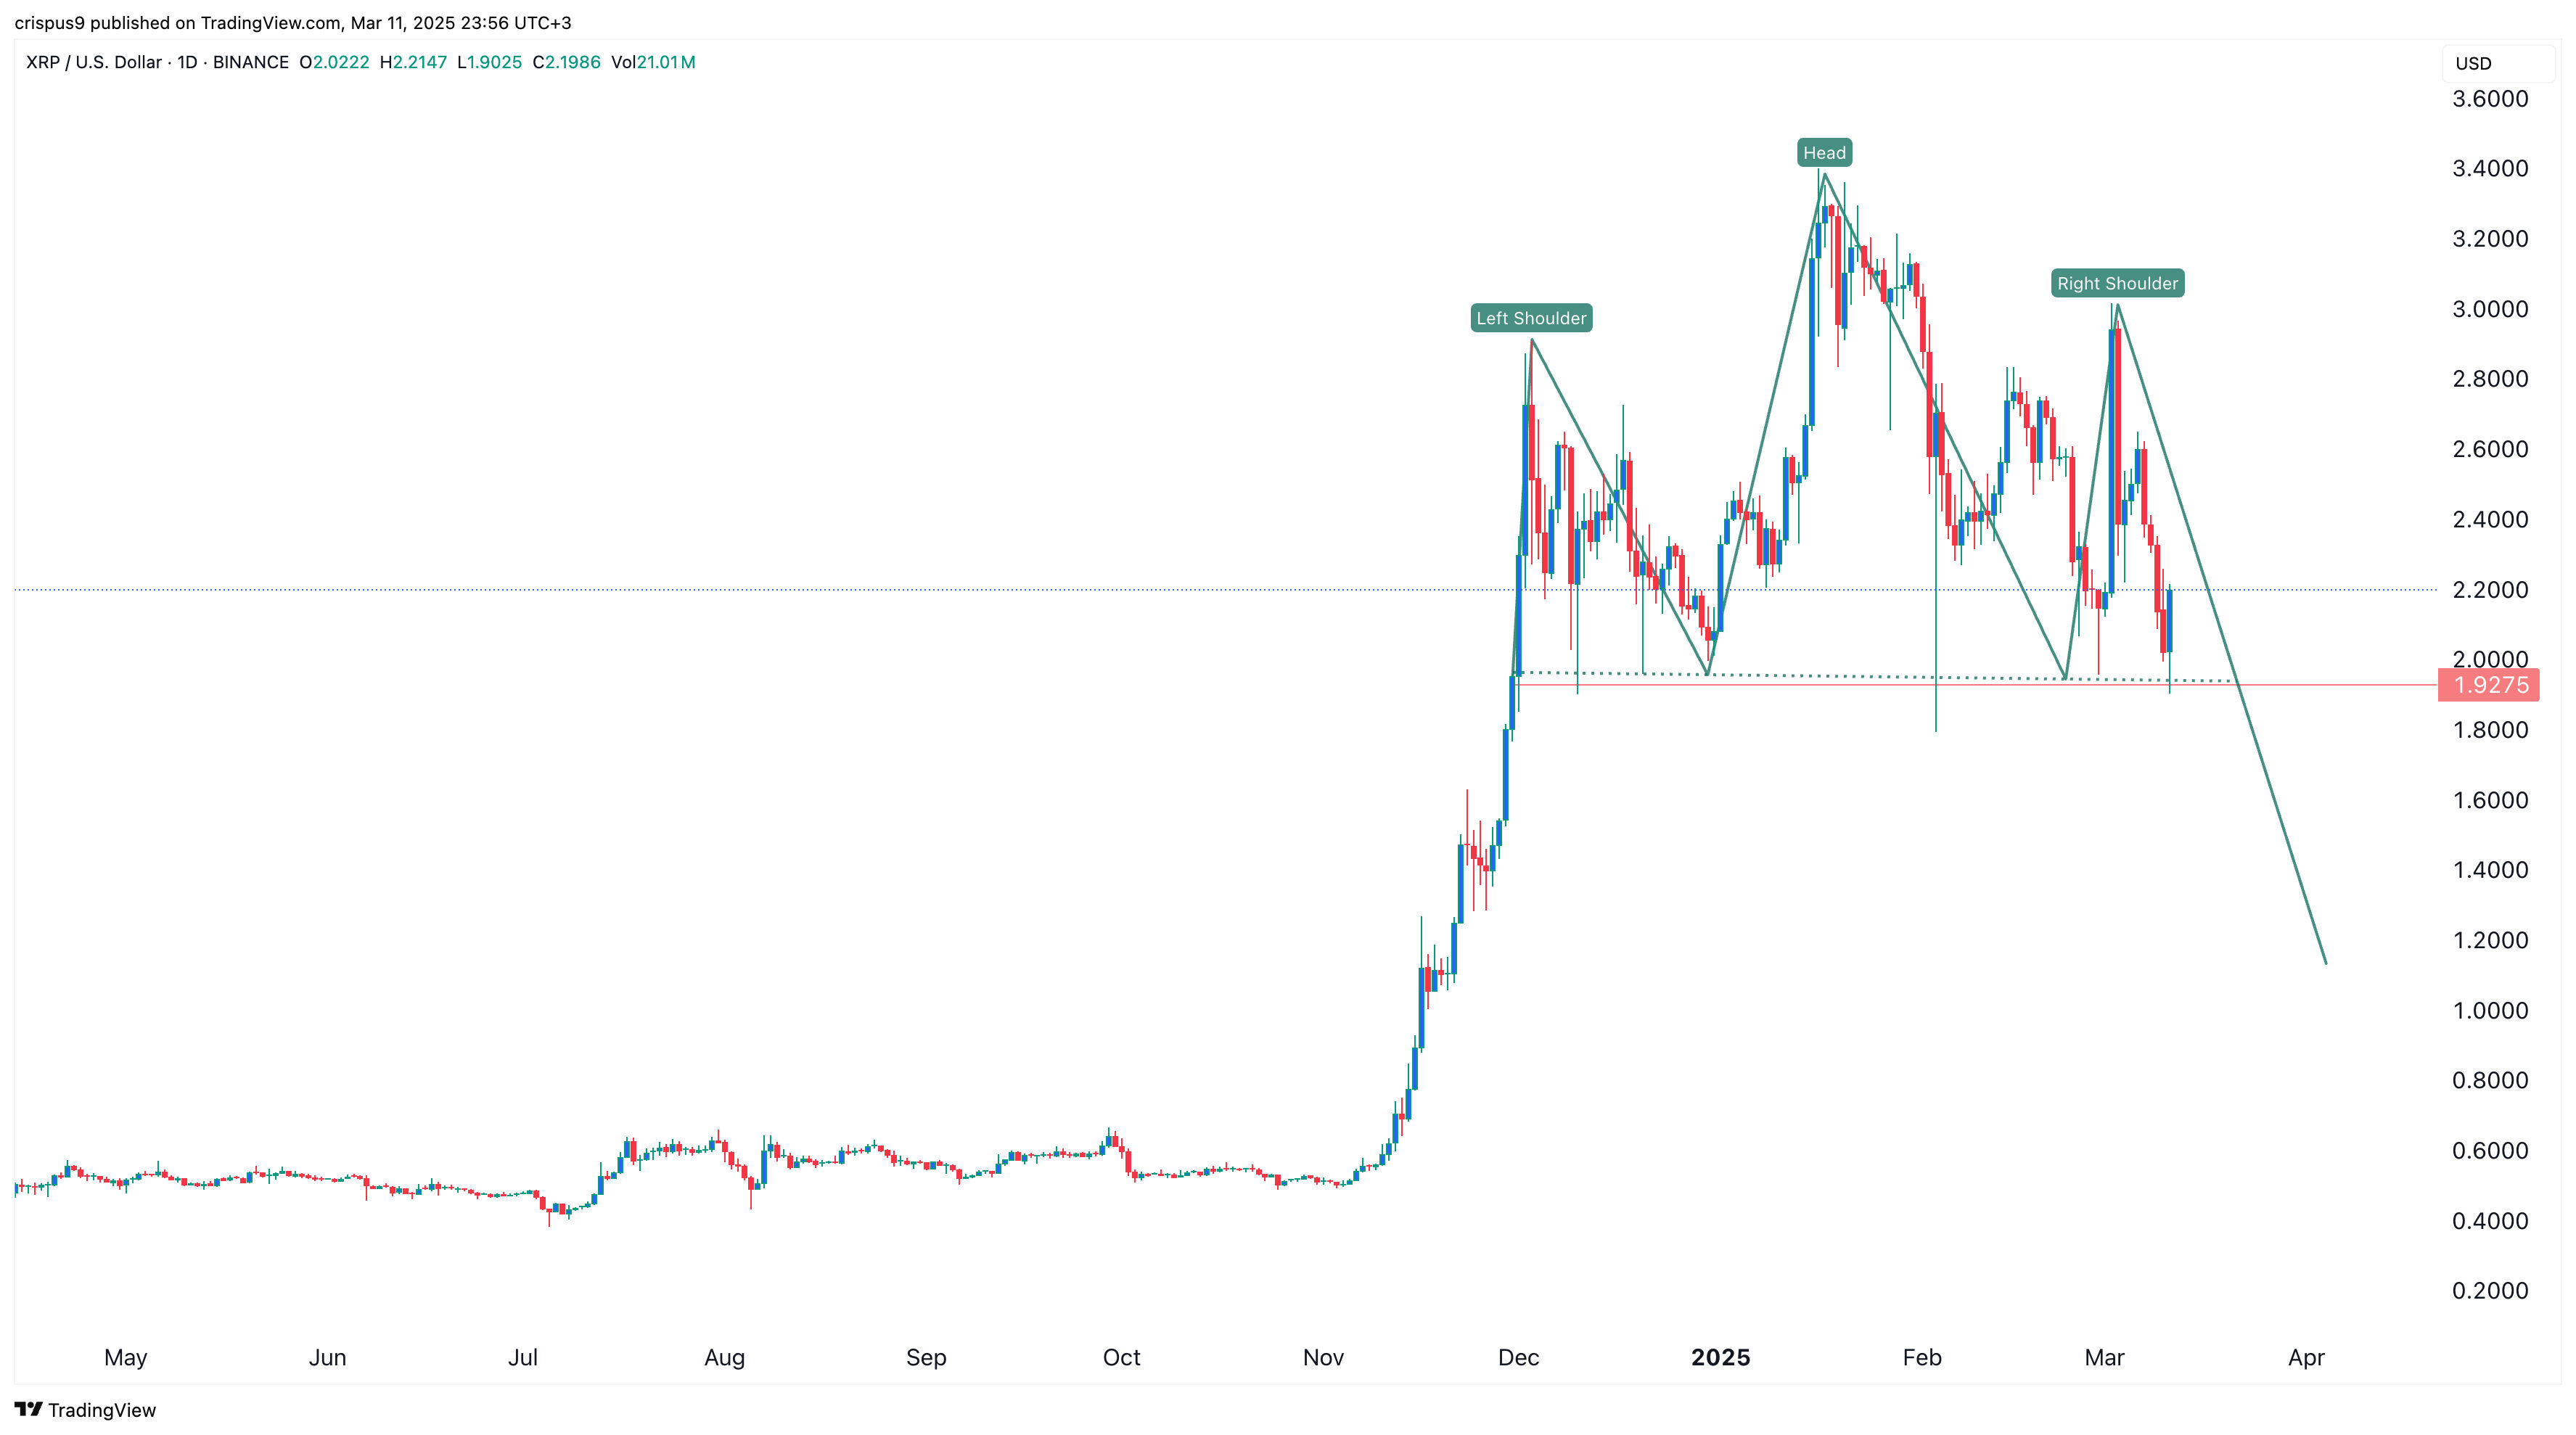
The XRP price crashed to a low of $1.9275 this week. This was a crucial support level since the coin has failed to move below it several times since January. It was also the neckline of the head and shoulders pattern, with the head at $3.4 and shoulders at $2, respectively.
The head-and-shoulders (H&S) pattern is one of the most bearish patterns in technical analysis. An asset tends to crash when it moves below the neckline. In XRP’s case, a move below that price will signal more downside, which may lead to panic selling as Ripple moves to the markdown phase of the Wyckoff Theory.
Therefore, the current outlook for XRP is neutral, with the key level to watch at $1.9275. A crash below that level will confirm the bearish XRP price forecast and raise the odds of it falling to $1. This bearish view will become invalid if the coin rises above the shoulders at $3.
ETH Price Forecast
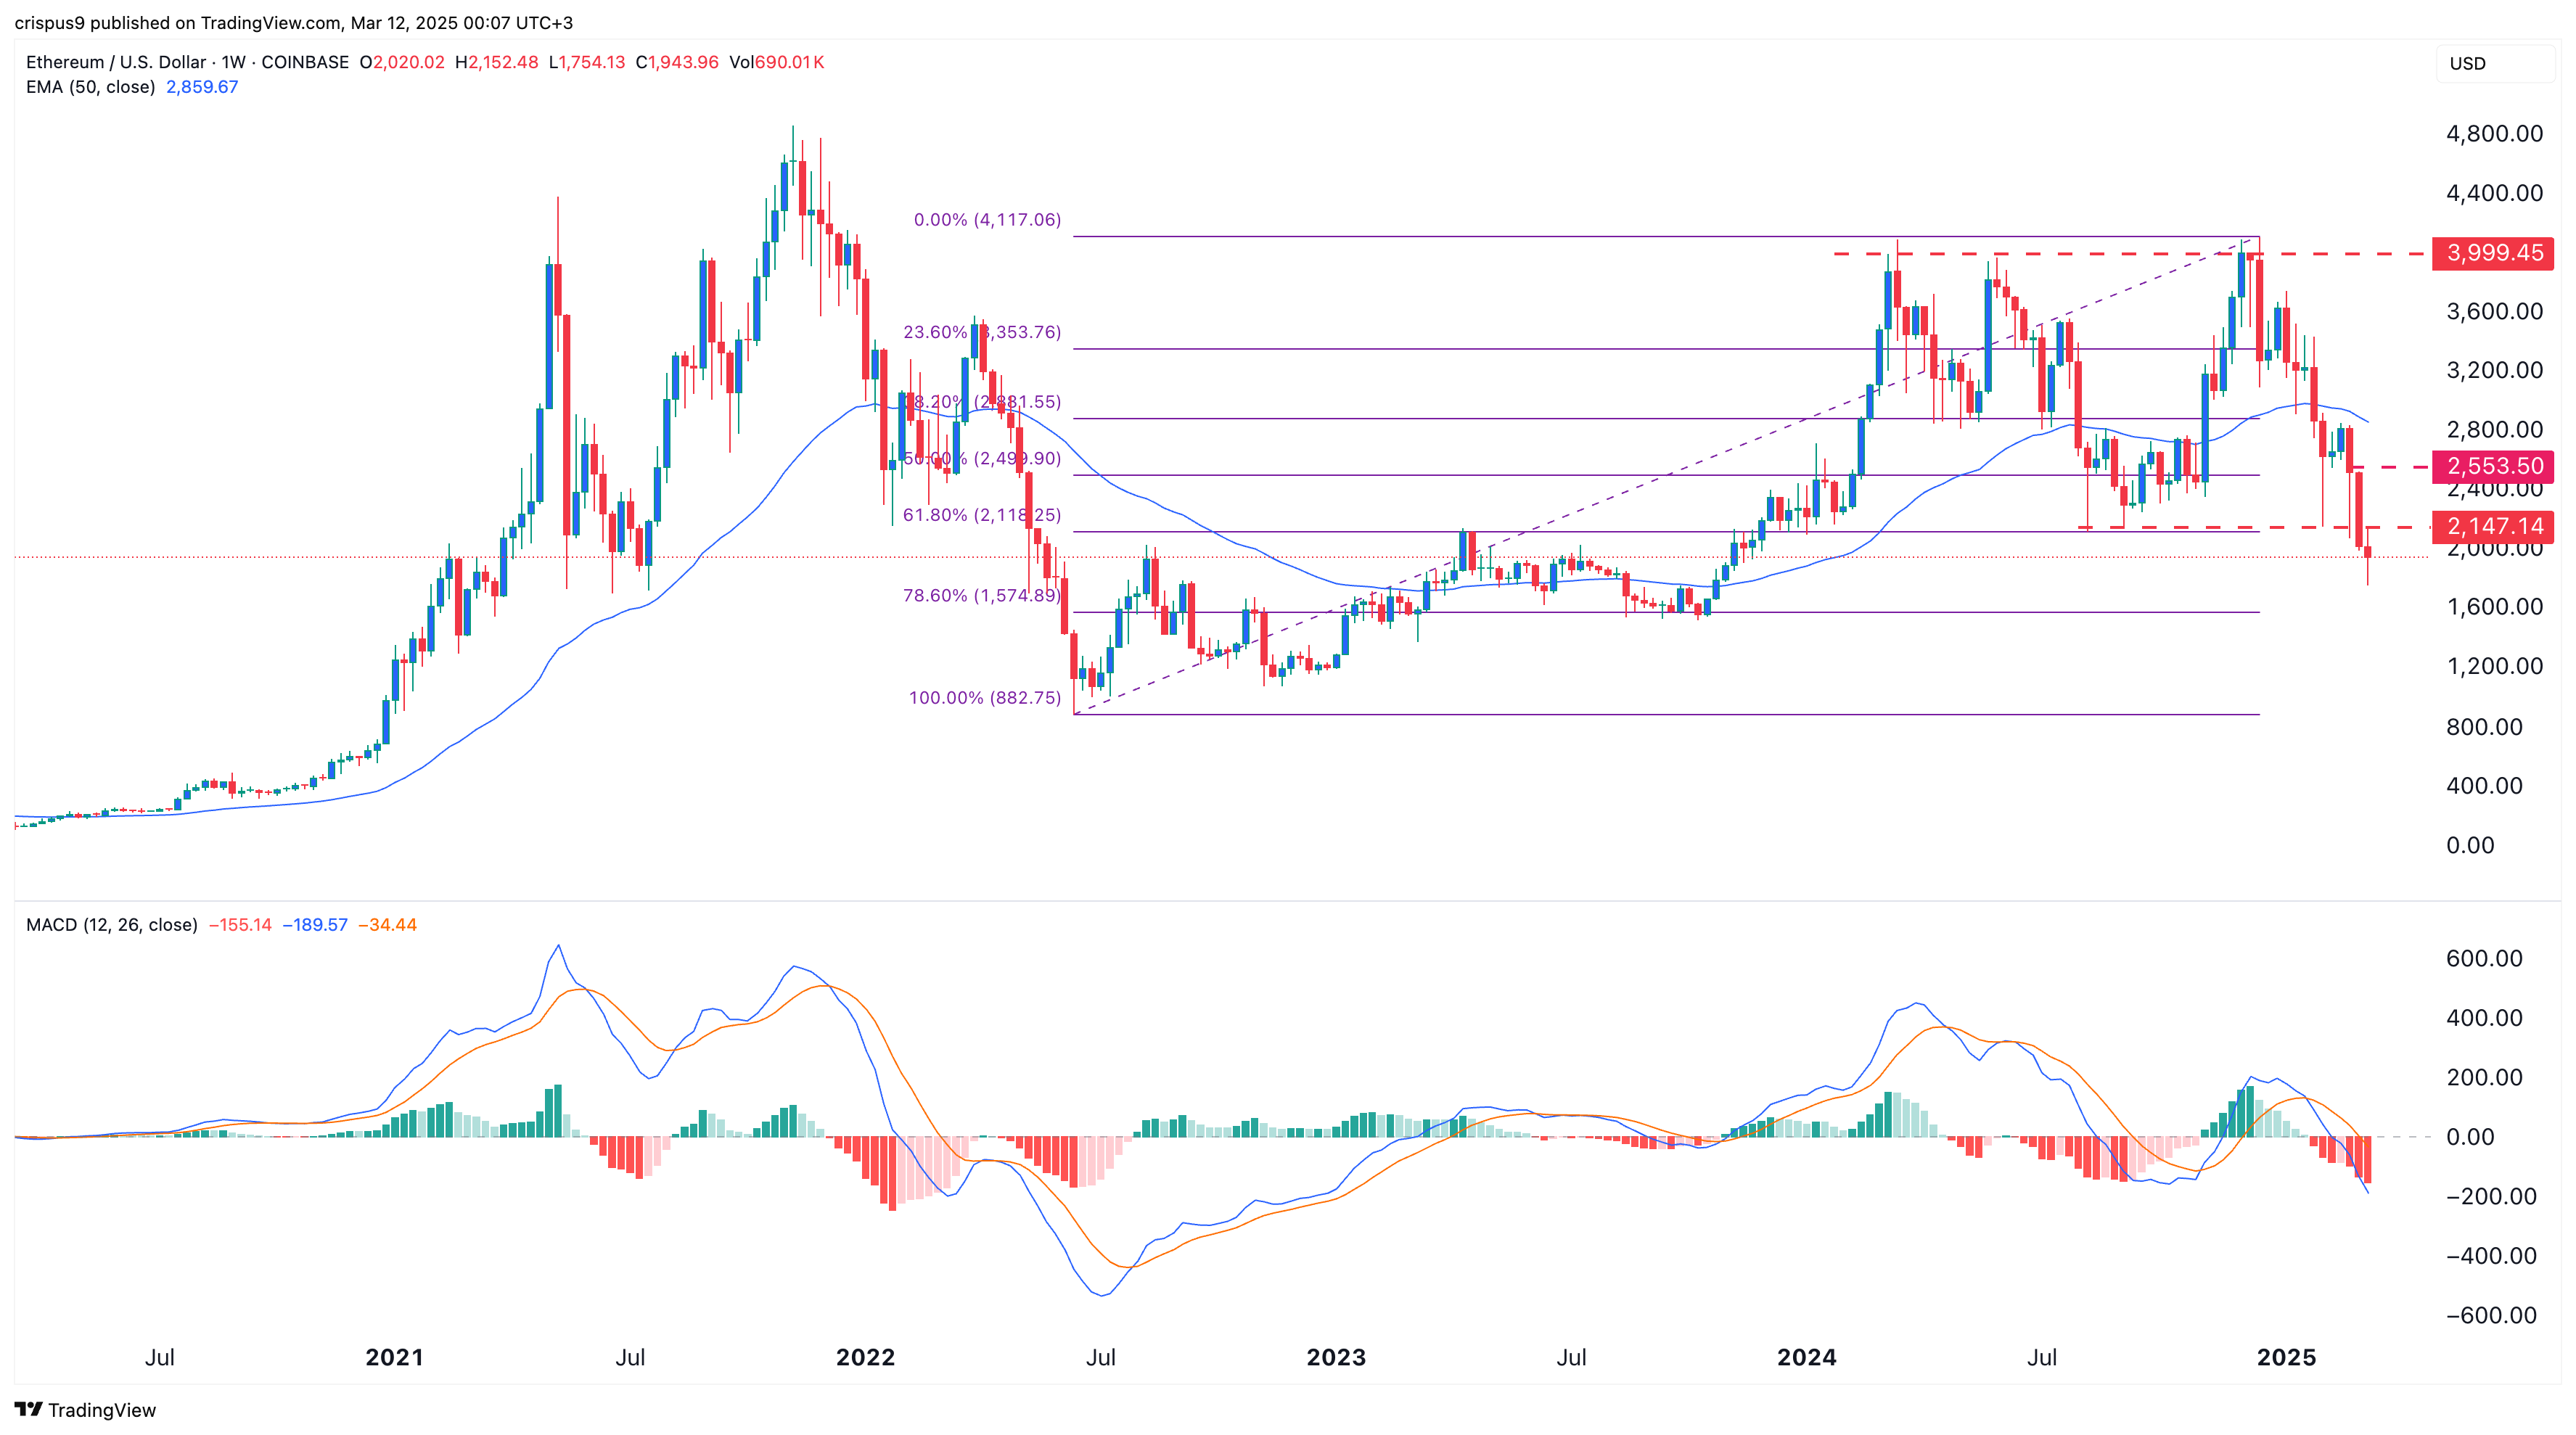
Ethereum price remains under pressure after falling for three straight weeks. It has slipped below the crucial support level at $2,147, the lowest swing on August 5 and the neckline of the triple-top pattern at $4,000.
ETH price has dropped below the 61.8% Fibonacci Retracement level at $2,150. It has also moved below the 50-week moving average, while the MACD has pointed downwards.
Therefore, the path of least resistance for the coin is bearish. The next point to watch is the psychological point at $1,500. A move above the resistance point at $2,200 will invalidate the bearish view.
Dogecoin Price Analysis
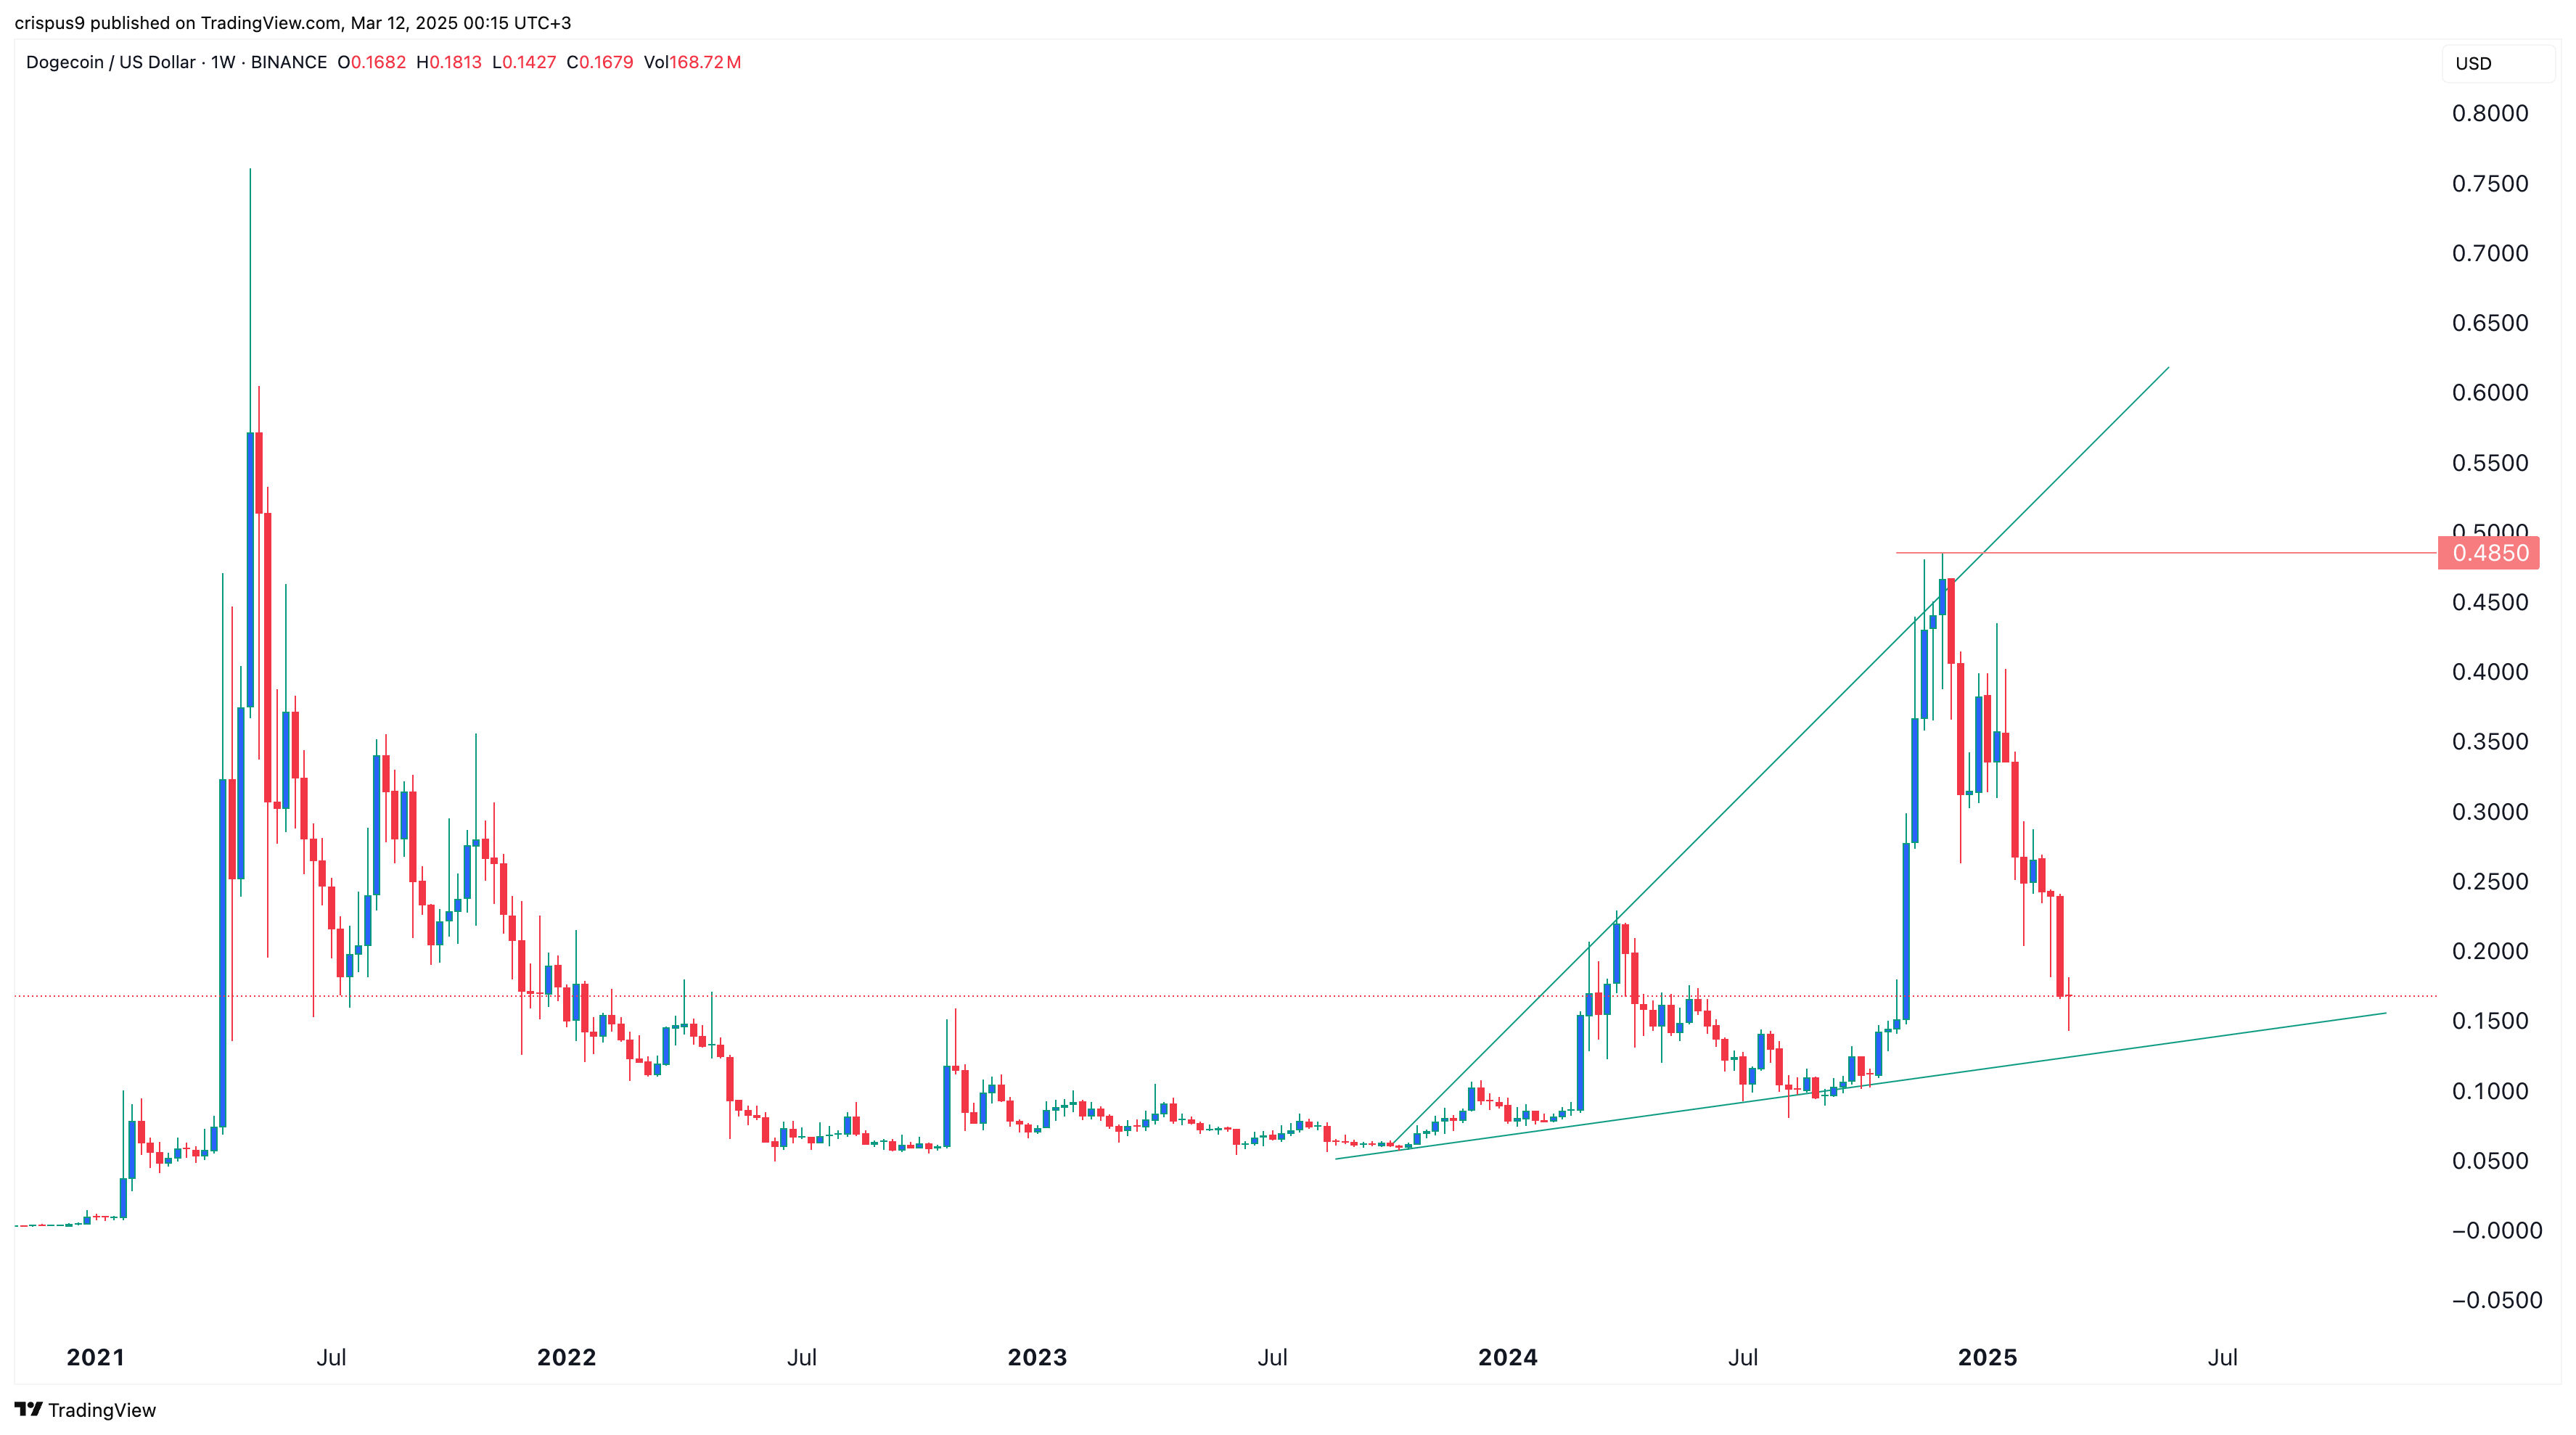
DOGE price peaked at $0.4850 in 2024 and then retreated sharply to the current $0.16. Positively, the coin has formed a falling wedge pattern on the daily chart. This pattern is made up of two falling and converging trendlines.
DOGE has formed a giant megaphone pattern on the weekly chart. This pattern comprises two ascending and diverging trendlines. In most cases, an asset tends to have a strong bullish breakout when it happens. It is approaching the lower boundary of the megaphone, indicating potential gains in the coming weeks. A retest of its 2024 highest point would signal a 192% above the current level.
READ MORE: The Pi Day is Here: Can the Pi Network Price Hit $3.14 This Week?