


Cryptocurrency prices continued their downward momentum as the fear and greed index plummeted to the extreme fear level of 18. Bitcoin (BTC) dropped to $77,700, while Ethereum (ETH) fell to $1,800, and Ripple (XRP) fell to $2, respectively. Solana (SOL) coin fell to $115, a significant drop from the year-to-date high of $294.
These tokens crashed as American stocks plunged, with the tech-heavy Nasdaq 100 index falling to 19,247 points, its lowest level since September last year. It has fallen by over 12% from its highest level this year, which has moved into a correction.
Crypto and stock prices have fallen as investors remain concerned about the American economy because of Donald Trump’s tariffs. So, what’s next for SOL, ETH, and XRP prices?
SOL Price Prediction
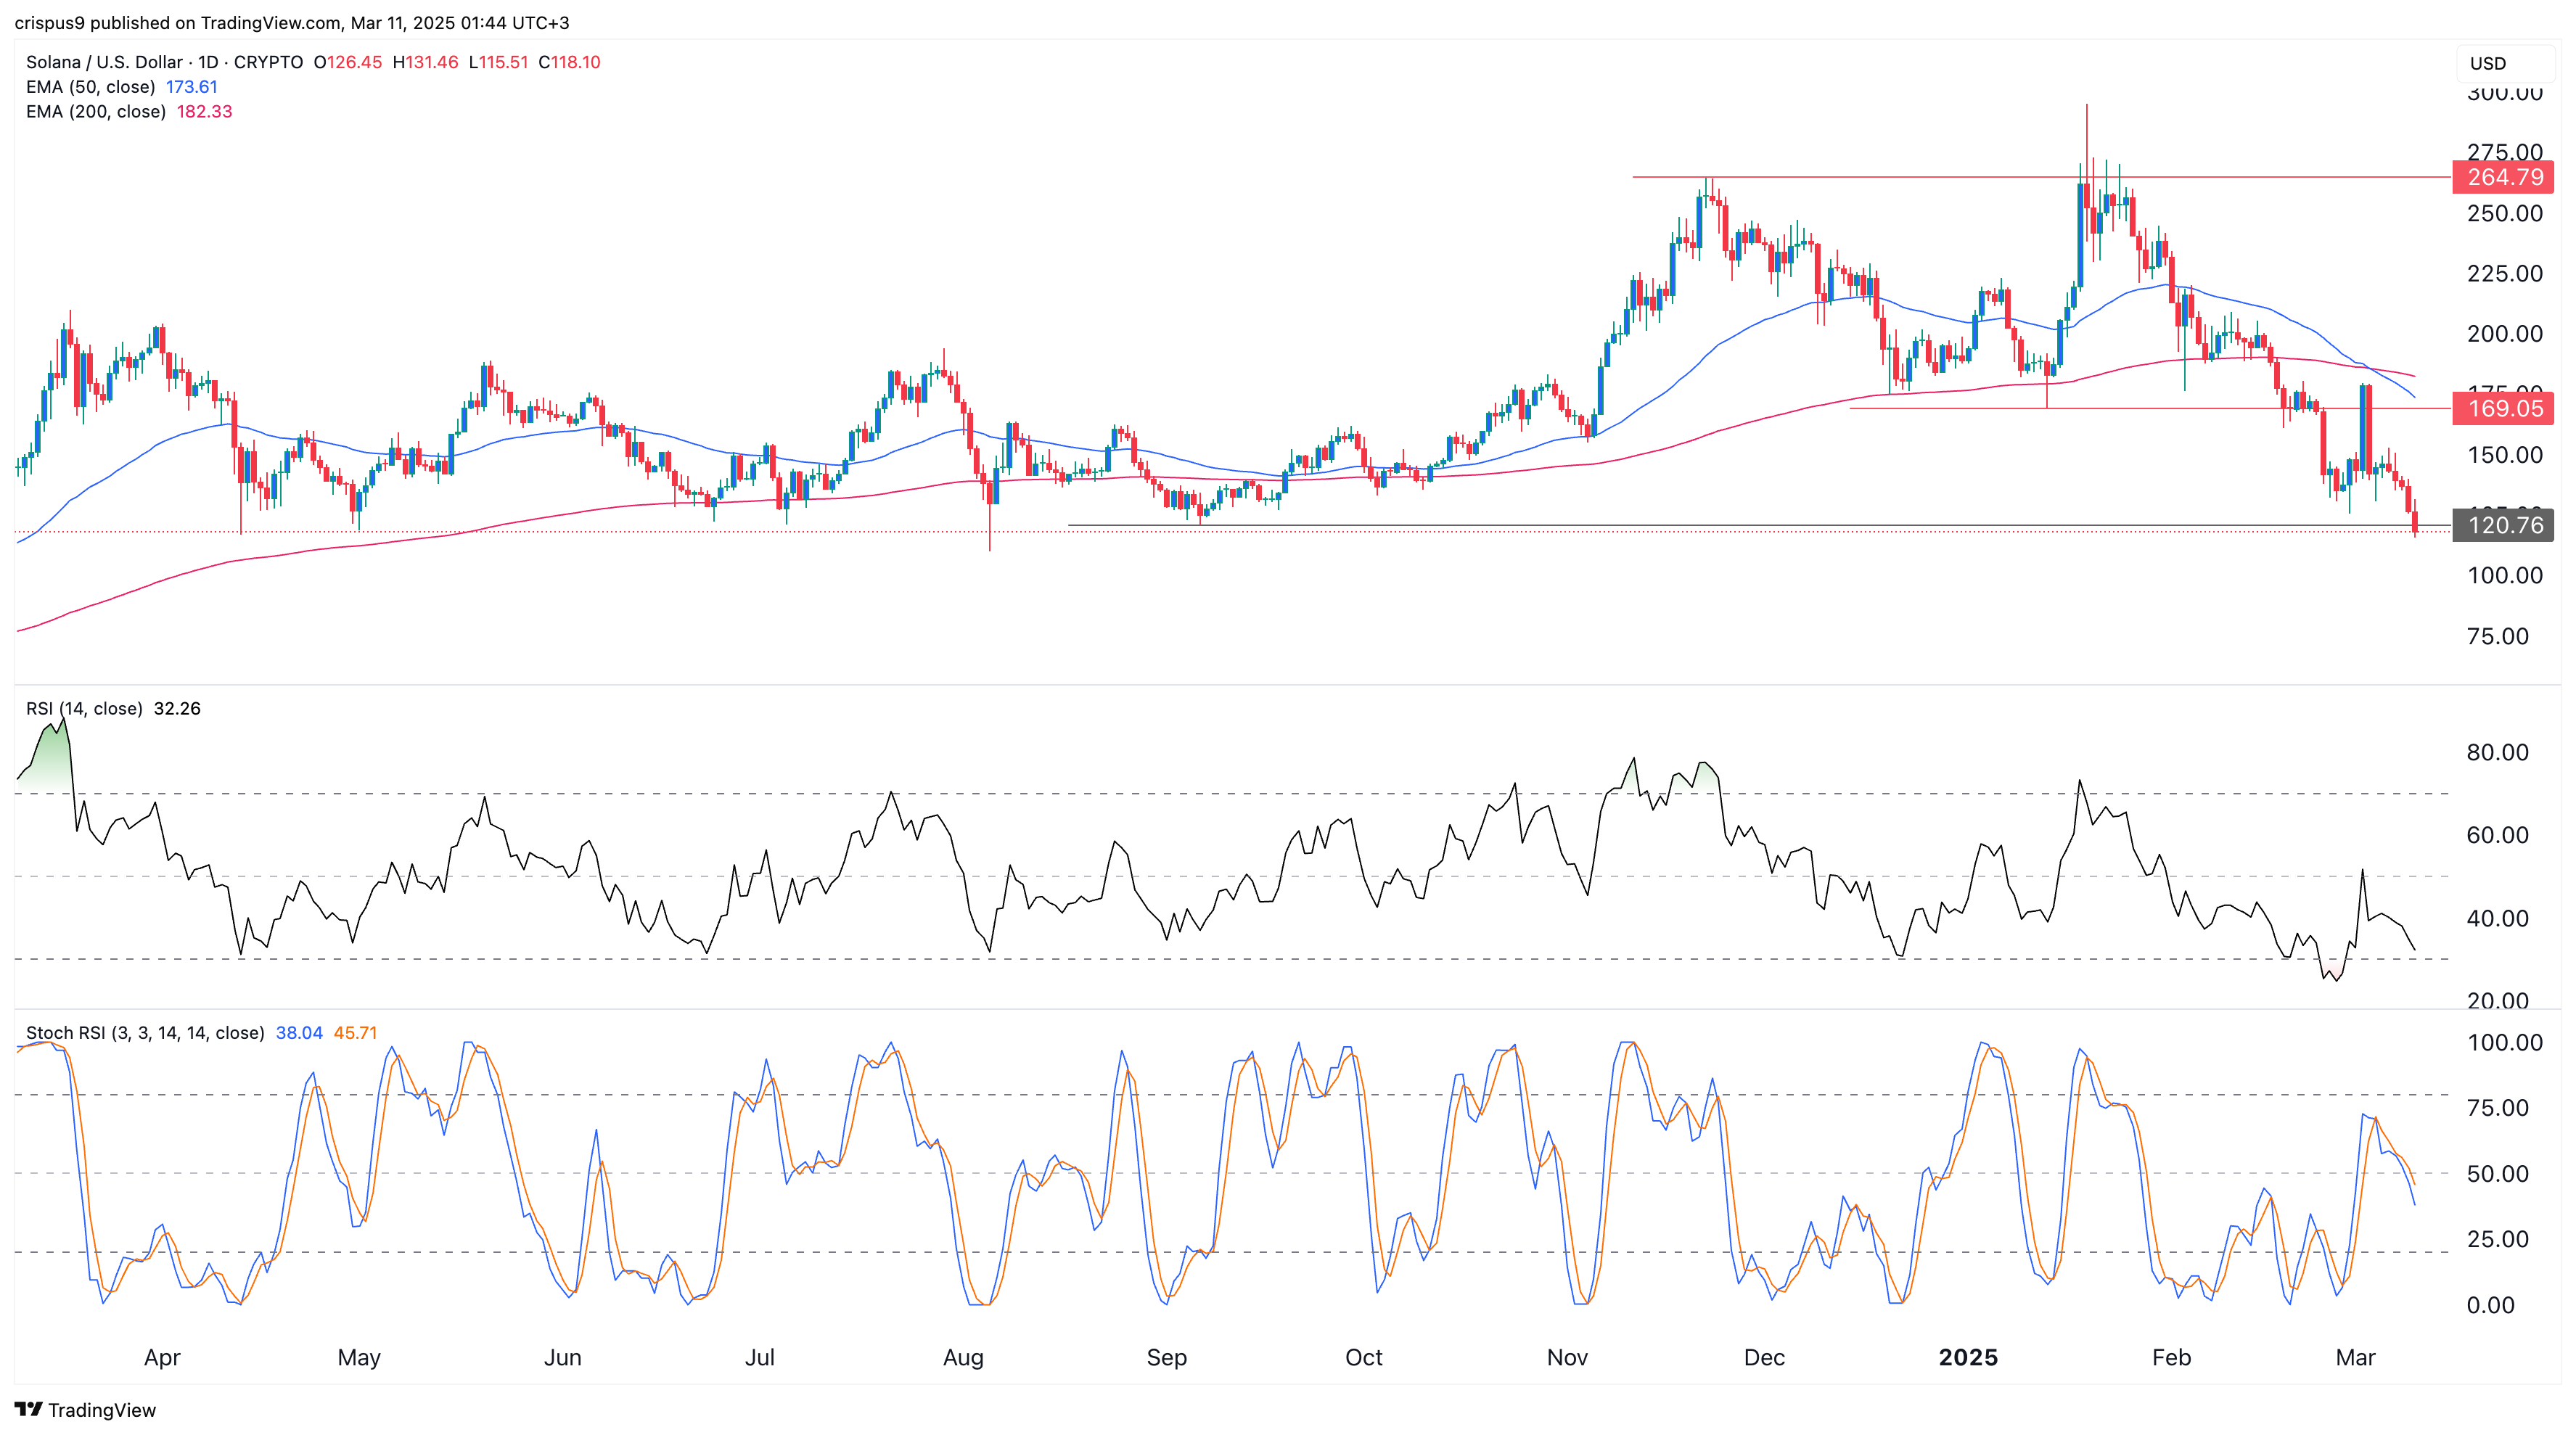
The daily chart shows that the SOL coin price has been in a strong freefall after peaking at $294 in January this year. It plunged below the key support levels at $264 and $169. At $264, it formed a double-top pattern, while at $169, it had its neckline.
Solana has formed a death cross pattern as the 50-day and 200-day EMAs crossed. A death cross is one of the most bearish patterns in the market.
The coin has also plunged below the key support at $120.7, its lowest point on September 6. Therefore, it’s likely that Solana will continue its decline as sellers target the next key support level at $100.
READ MORE: Solana Rivals to Buy That Could 5X as SOL Price Forms a Death Cross
ETH Price Forecast
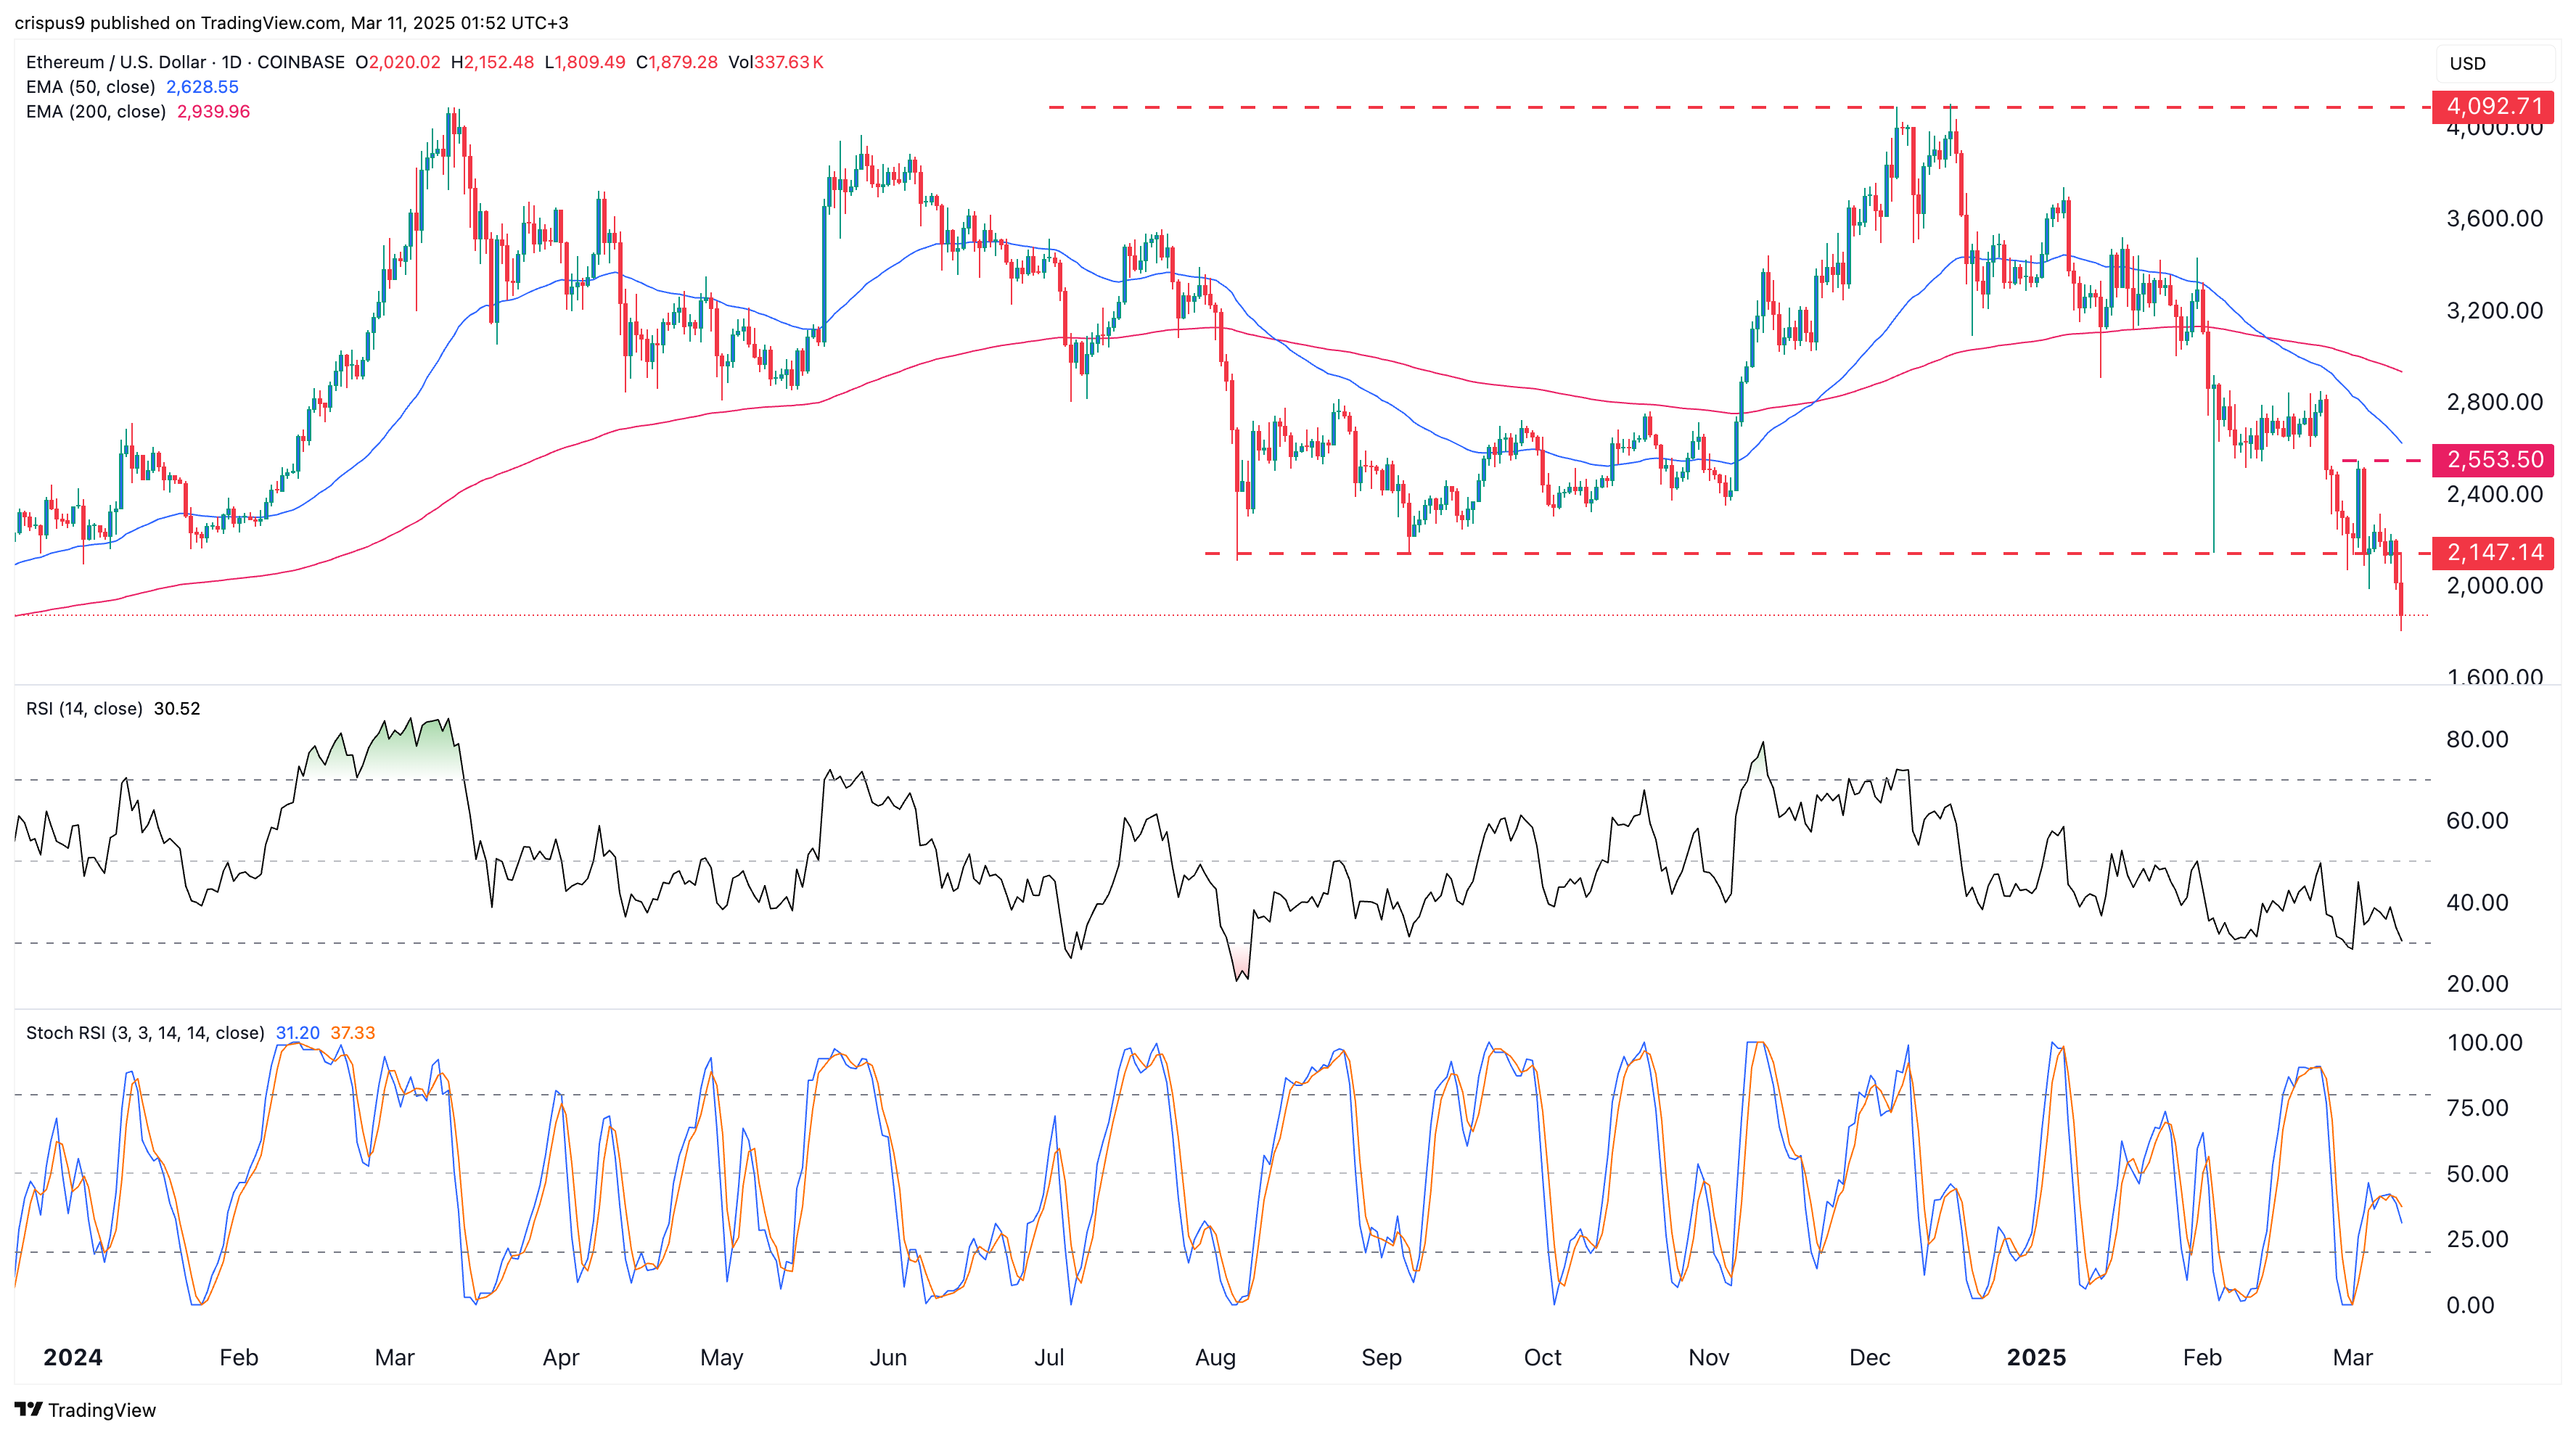
Ethereum price has been in a strong freefall in the past few months after finding substantial resistance at $4,092. It formed a triple-top pattern at that level and then crashed below the neckline at $2,147, its lowest swing in August last year.
The ETH price has dropped below all moving averages, while the Relative Strength Index (RSI) has continued falling. Therefore, the ETH price will likely continue falling, with the next reference level to watch being $1,500. A drop below that level could indicate a further decline to $1,000.
READ MORE: Best 3 Ethereum Rivals Under $1 to Turn $100 to $1000 in 2025
XRP Price Analysis
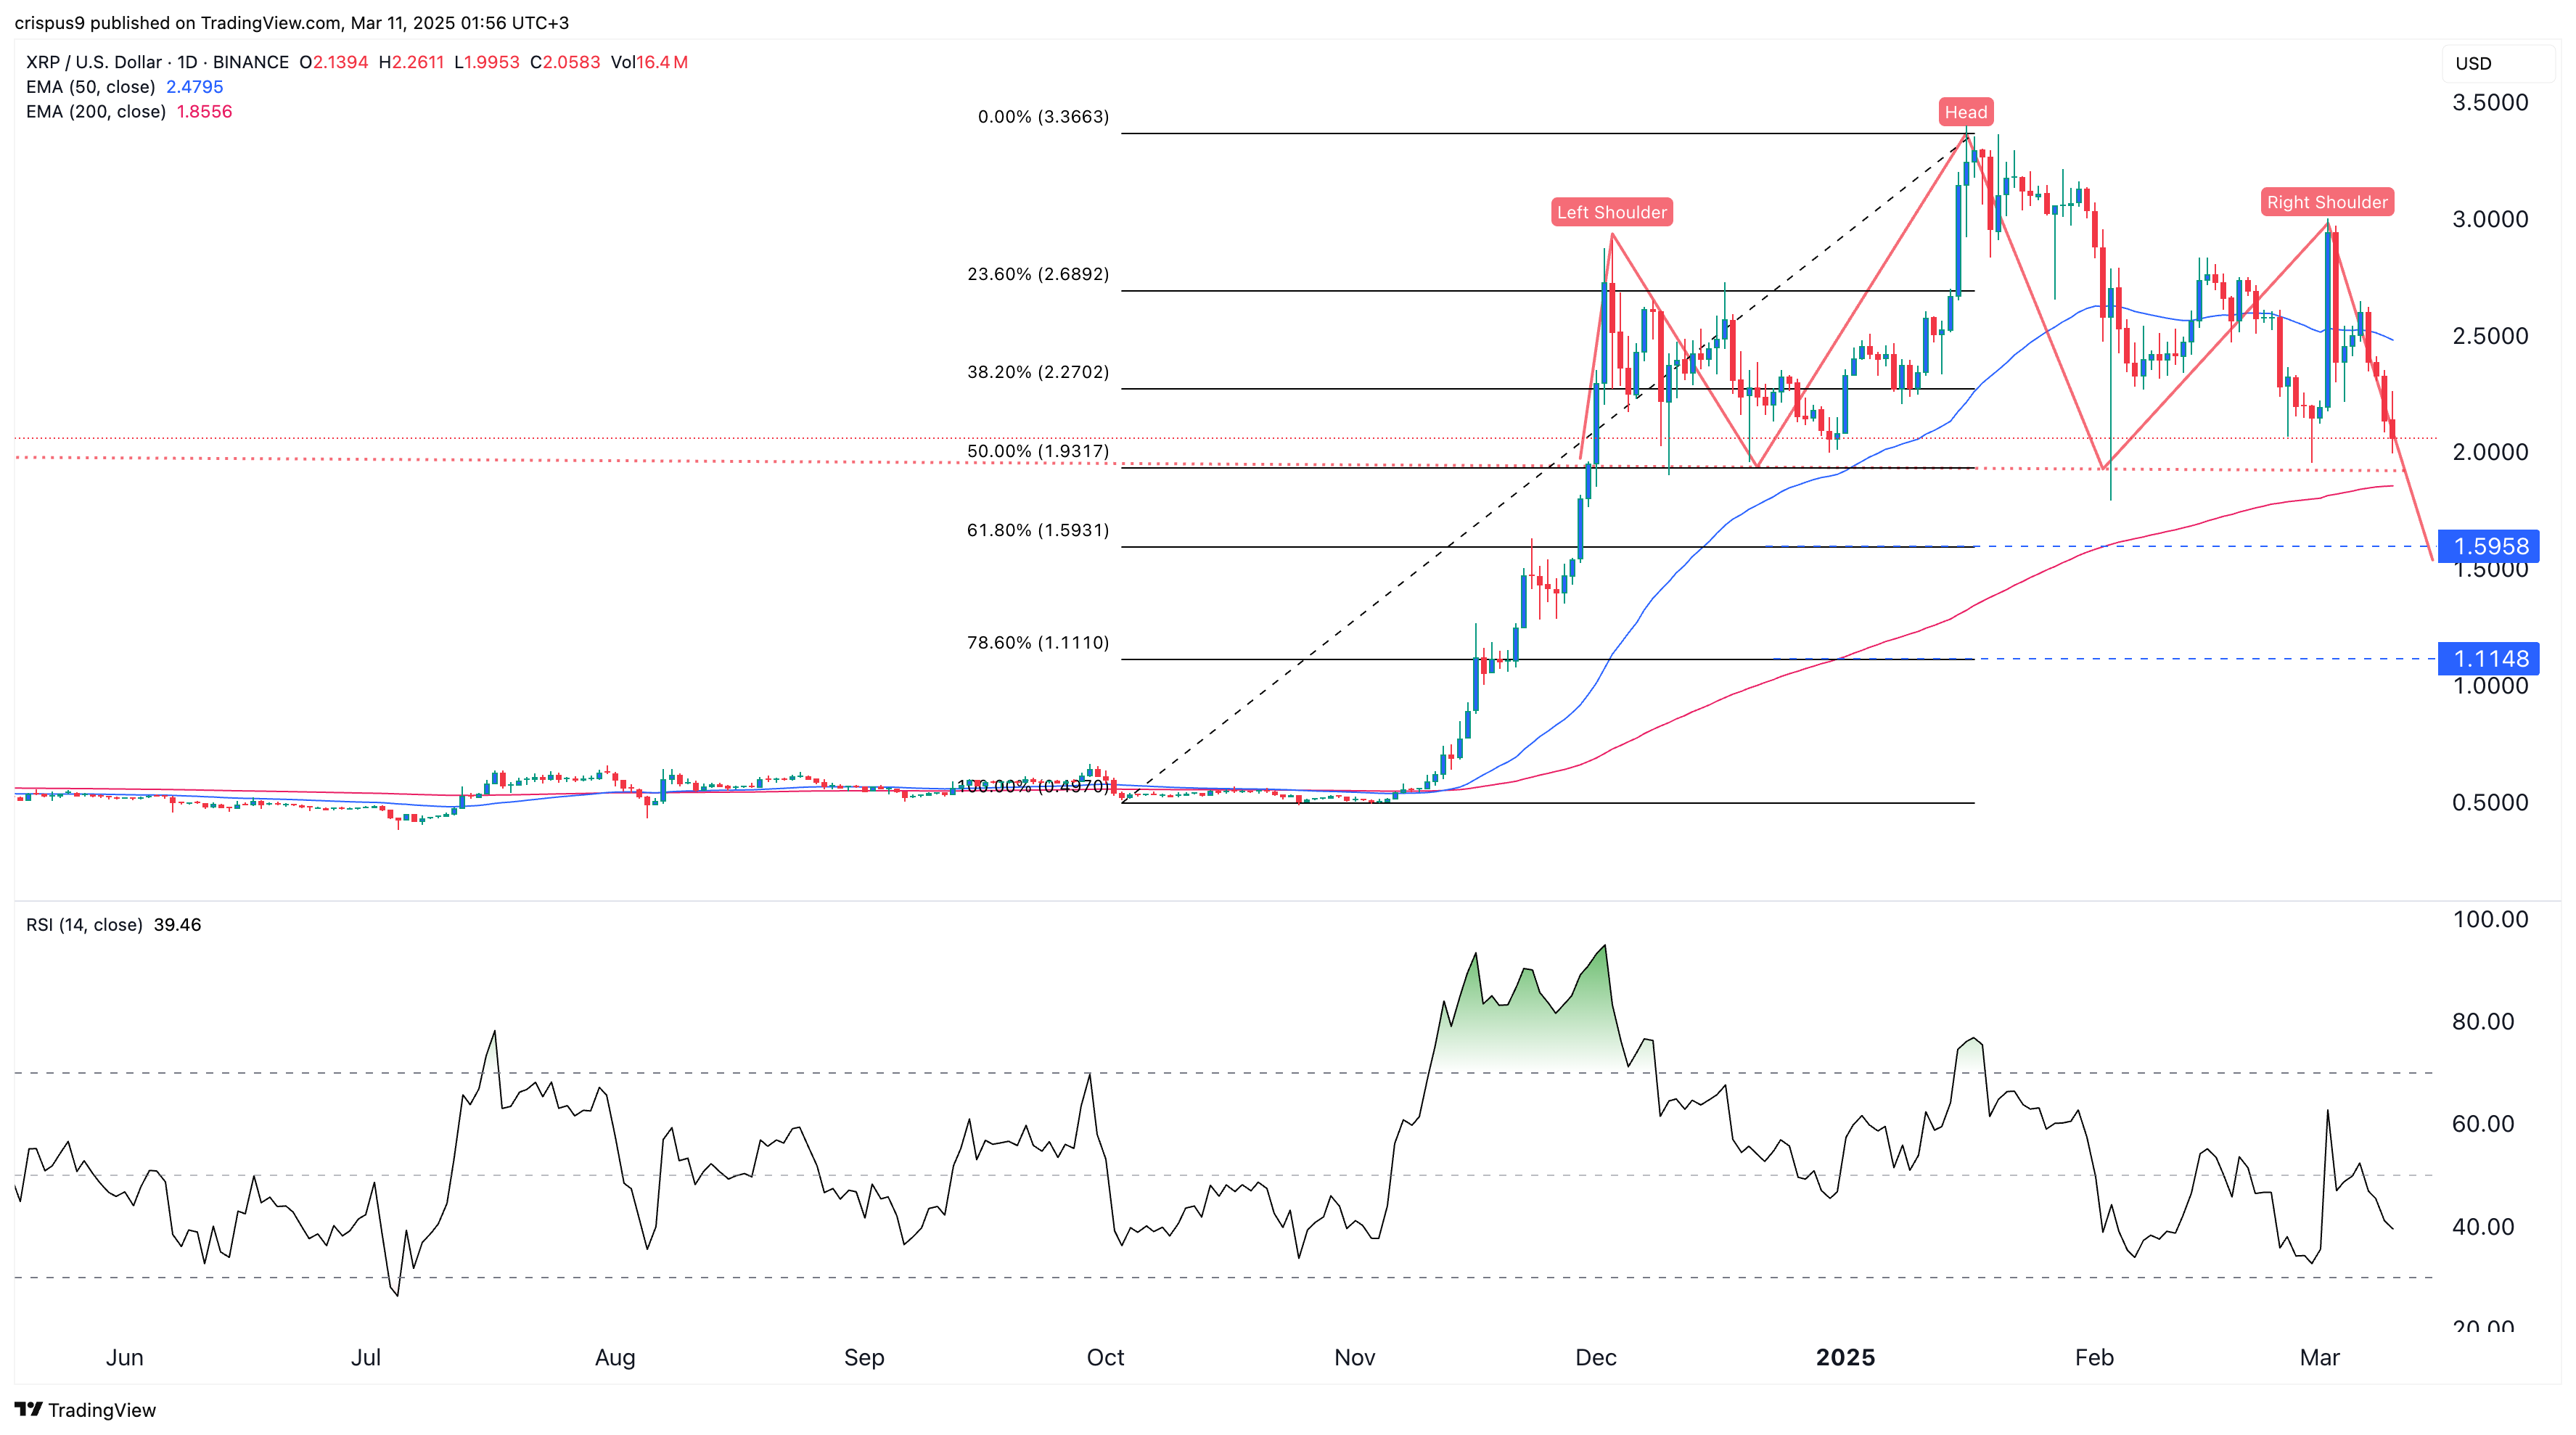
The daily chart shows that XRP has been in a strong downtrend over the past few days. It has dropped below the 38.2% Fibonacci Retracement level at $2.2702 and is now approaching the 50% point at $1.93. The coin has also dropped below the 50-day moving average.
Most importantly, the coin has formed a head and shoulders pattern, a popular bearish continuation sign. Therefore, it’s likely that Ripple will continue its decline as it enters the markdown phase of the Wyckoff Theory. That drop will see it crash to the next key support level at $1.50, followed by $1.
READ MORE: Is the AI Token Hype Over? Near, FET, AGIX Post Major Losses