


Crypto prices remained under pressure on Friday morning, and their outlook may worsen as the blue-chip S&P 500 index flashed a sell signal. Bitcoin price remained below the key resistance at $83,000, while XRP and ADA were in a bear market.
S&P 500 Index Flashes Sell Signal
The S&P 500 index flashed a sell signal after crashing in the last six days. It has moved below the 50-day moving average and the ascending wedge chart pattern. A wedge is a popular bearish sign made up of two ascending and converging trendlines, which are now nearing their confluence levels.
In most cases, a wedge usually results in a strong bear breakdown, which, in this case, may push it to the next support at $5,777, the lowest swing on January 13. A drop below that support level will point to more downside to $5,500. In the worst case, the index may fall to $5,131, its lowest level in August 2024.
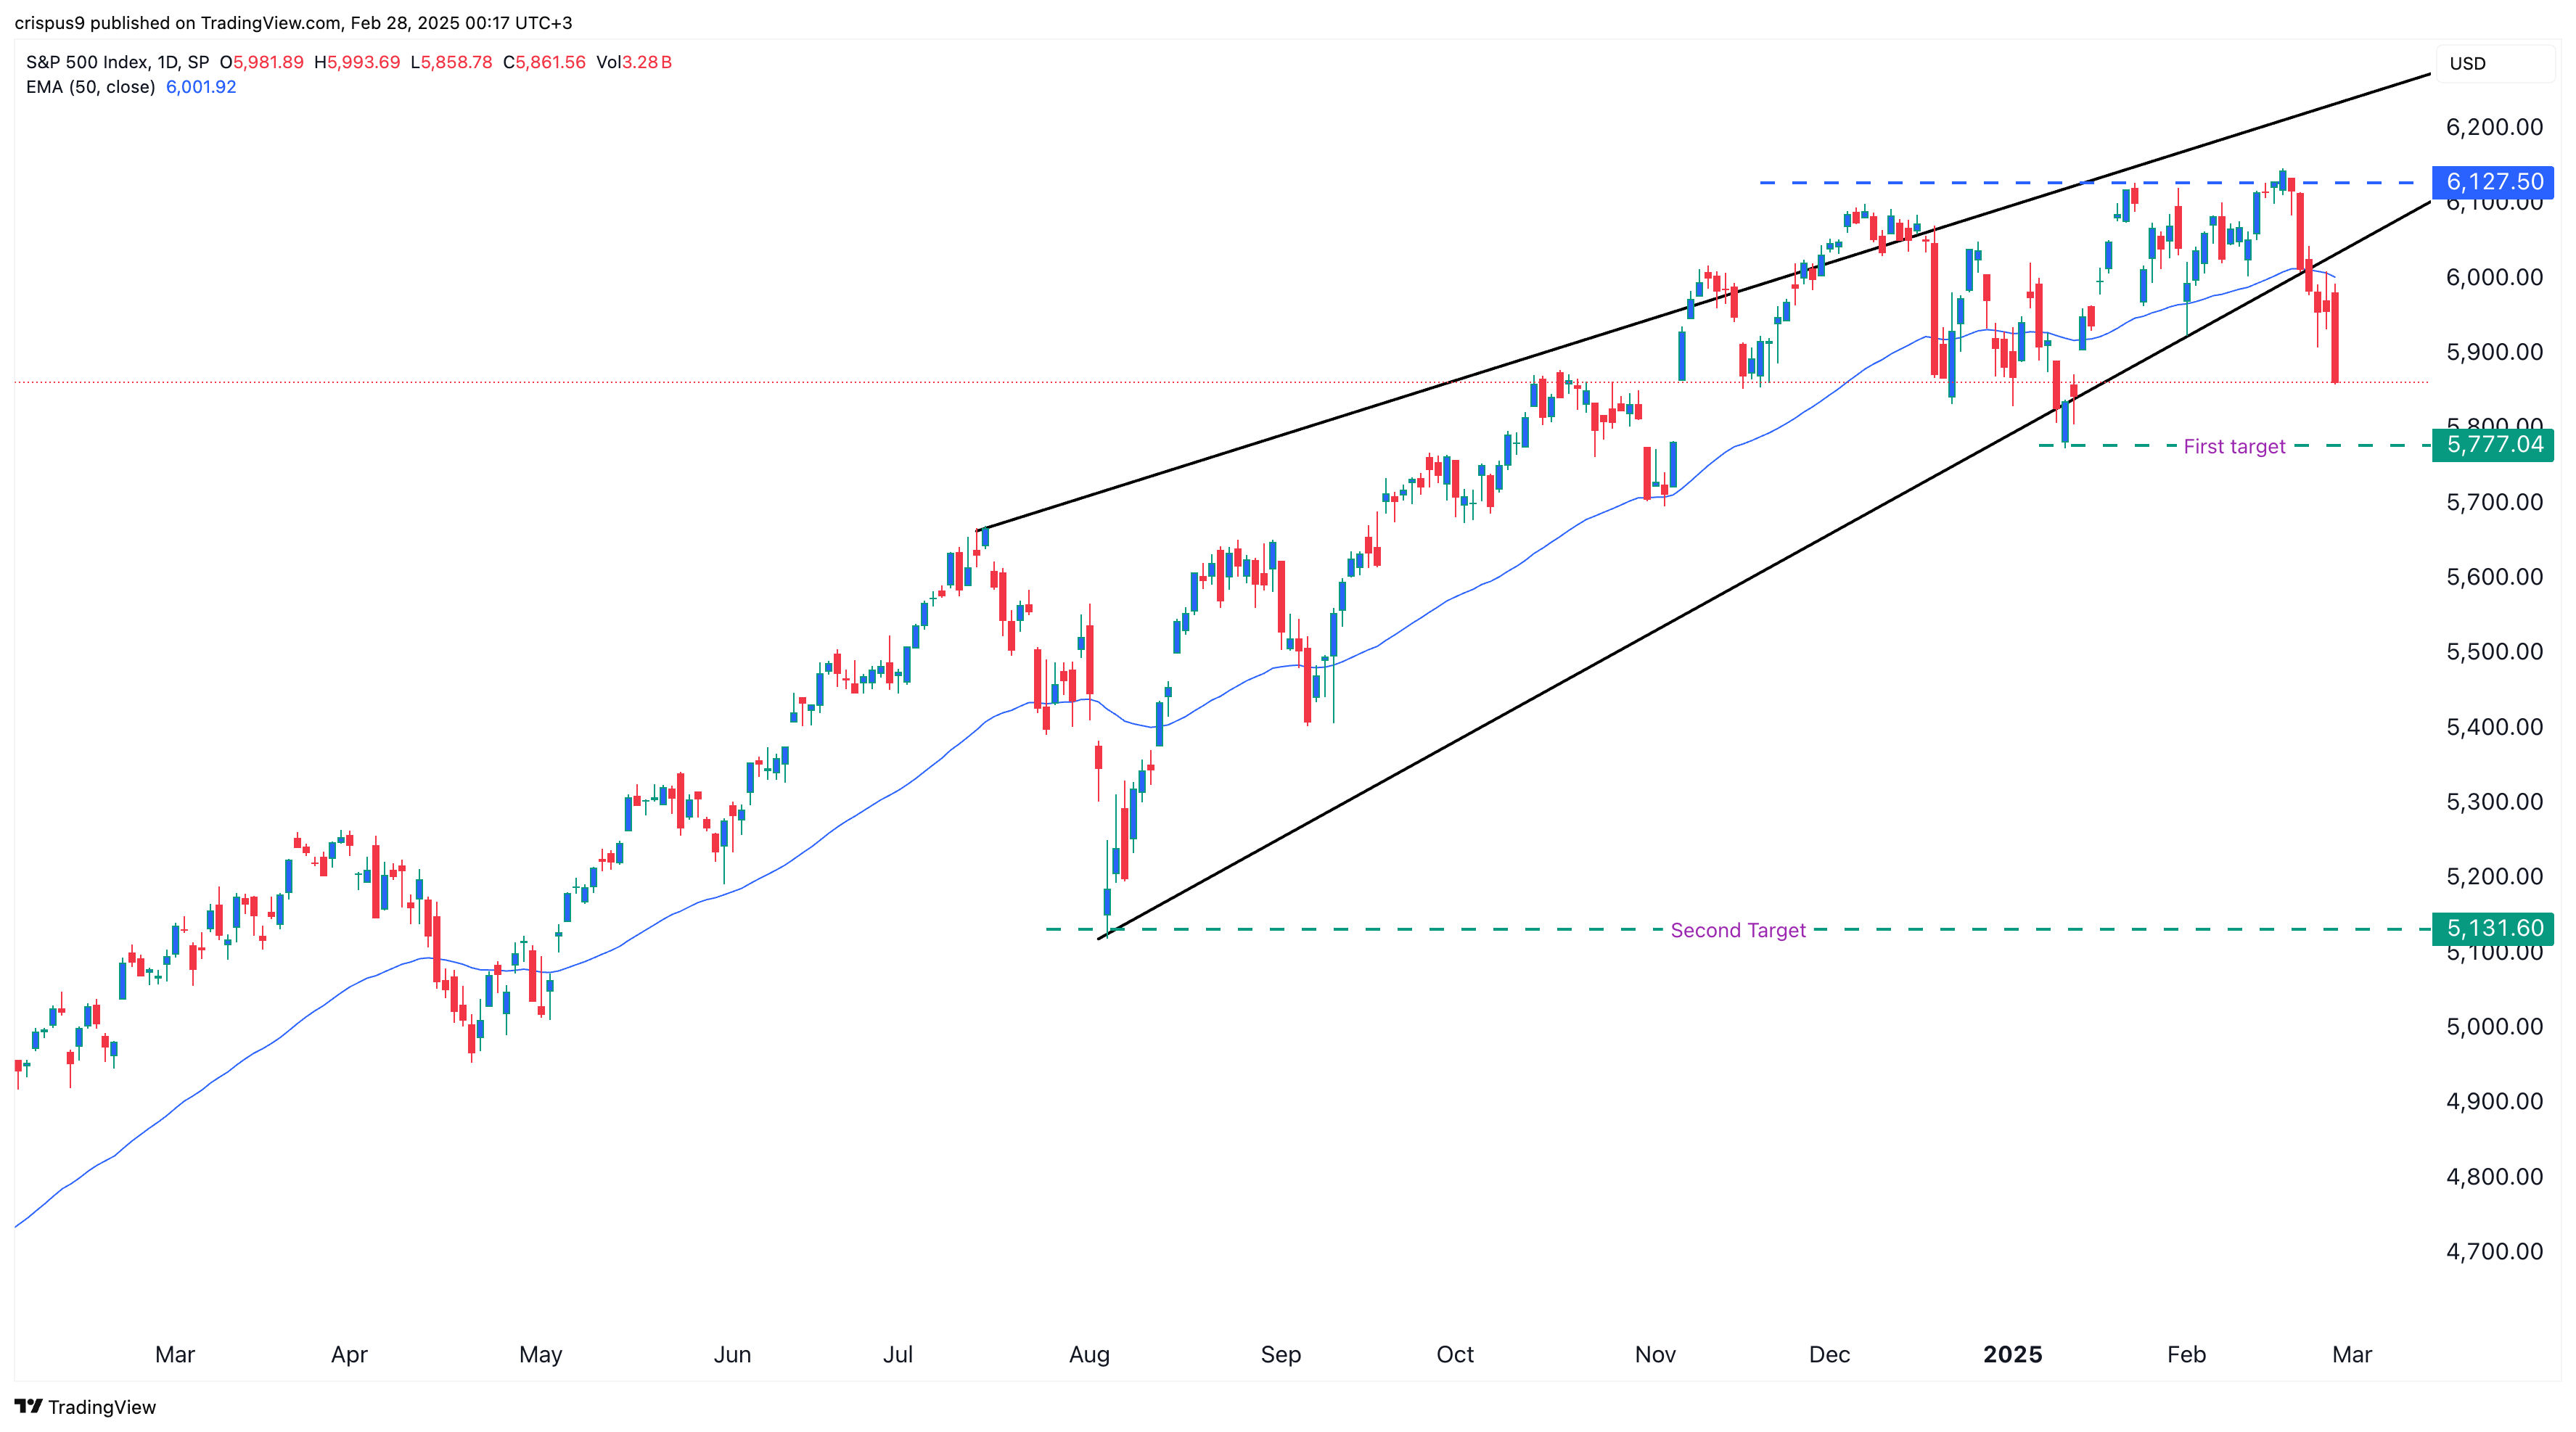
The S&P 500 index is crashing because of Donald Trump’s tariff threats and NVIDIA earnings, which showed that the artificial intelligence (AI) industry was slowing. Tariffs will lower corporate margins, reduce consumer spending, and force the Federal Reserve to choose between focusing on inflation or growth.
A focus on growth may see it cut interest rates, a good thing for stocks and crypto, but one that will stimulate inflation. In a note, an eToro analyst told Bloomberg:
“Investors want lower rates from the Fed, but they don’t want to get there by seeing a notable deterioration in the underlying economy. At the very least, if the economy is going to slow, investors will want to see inflation slow down too.”
Bitcoin Price Forecast
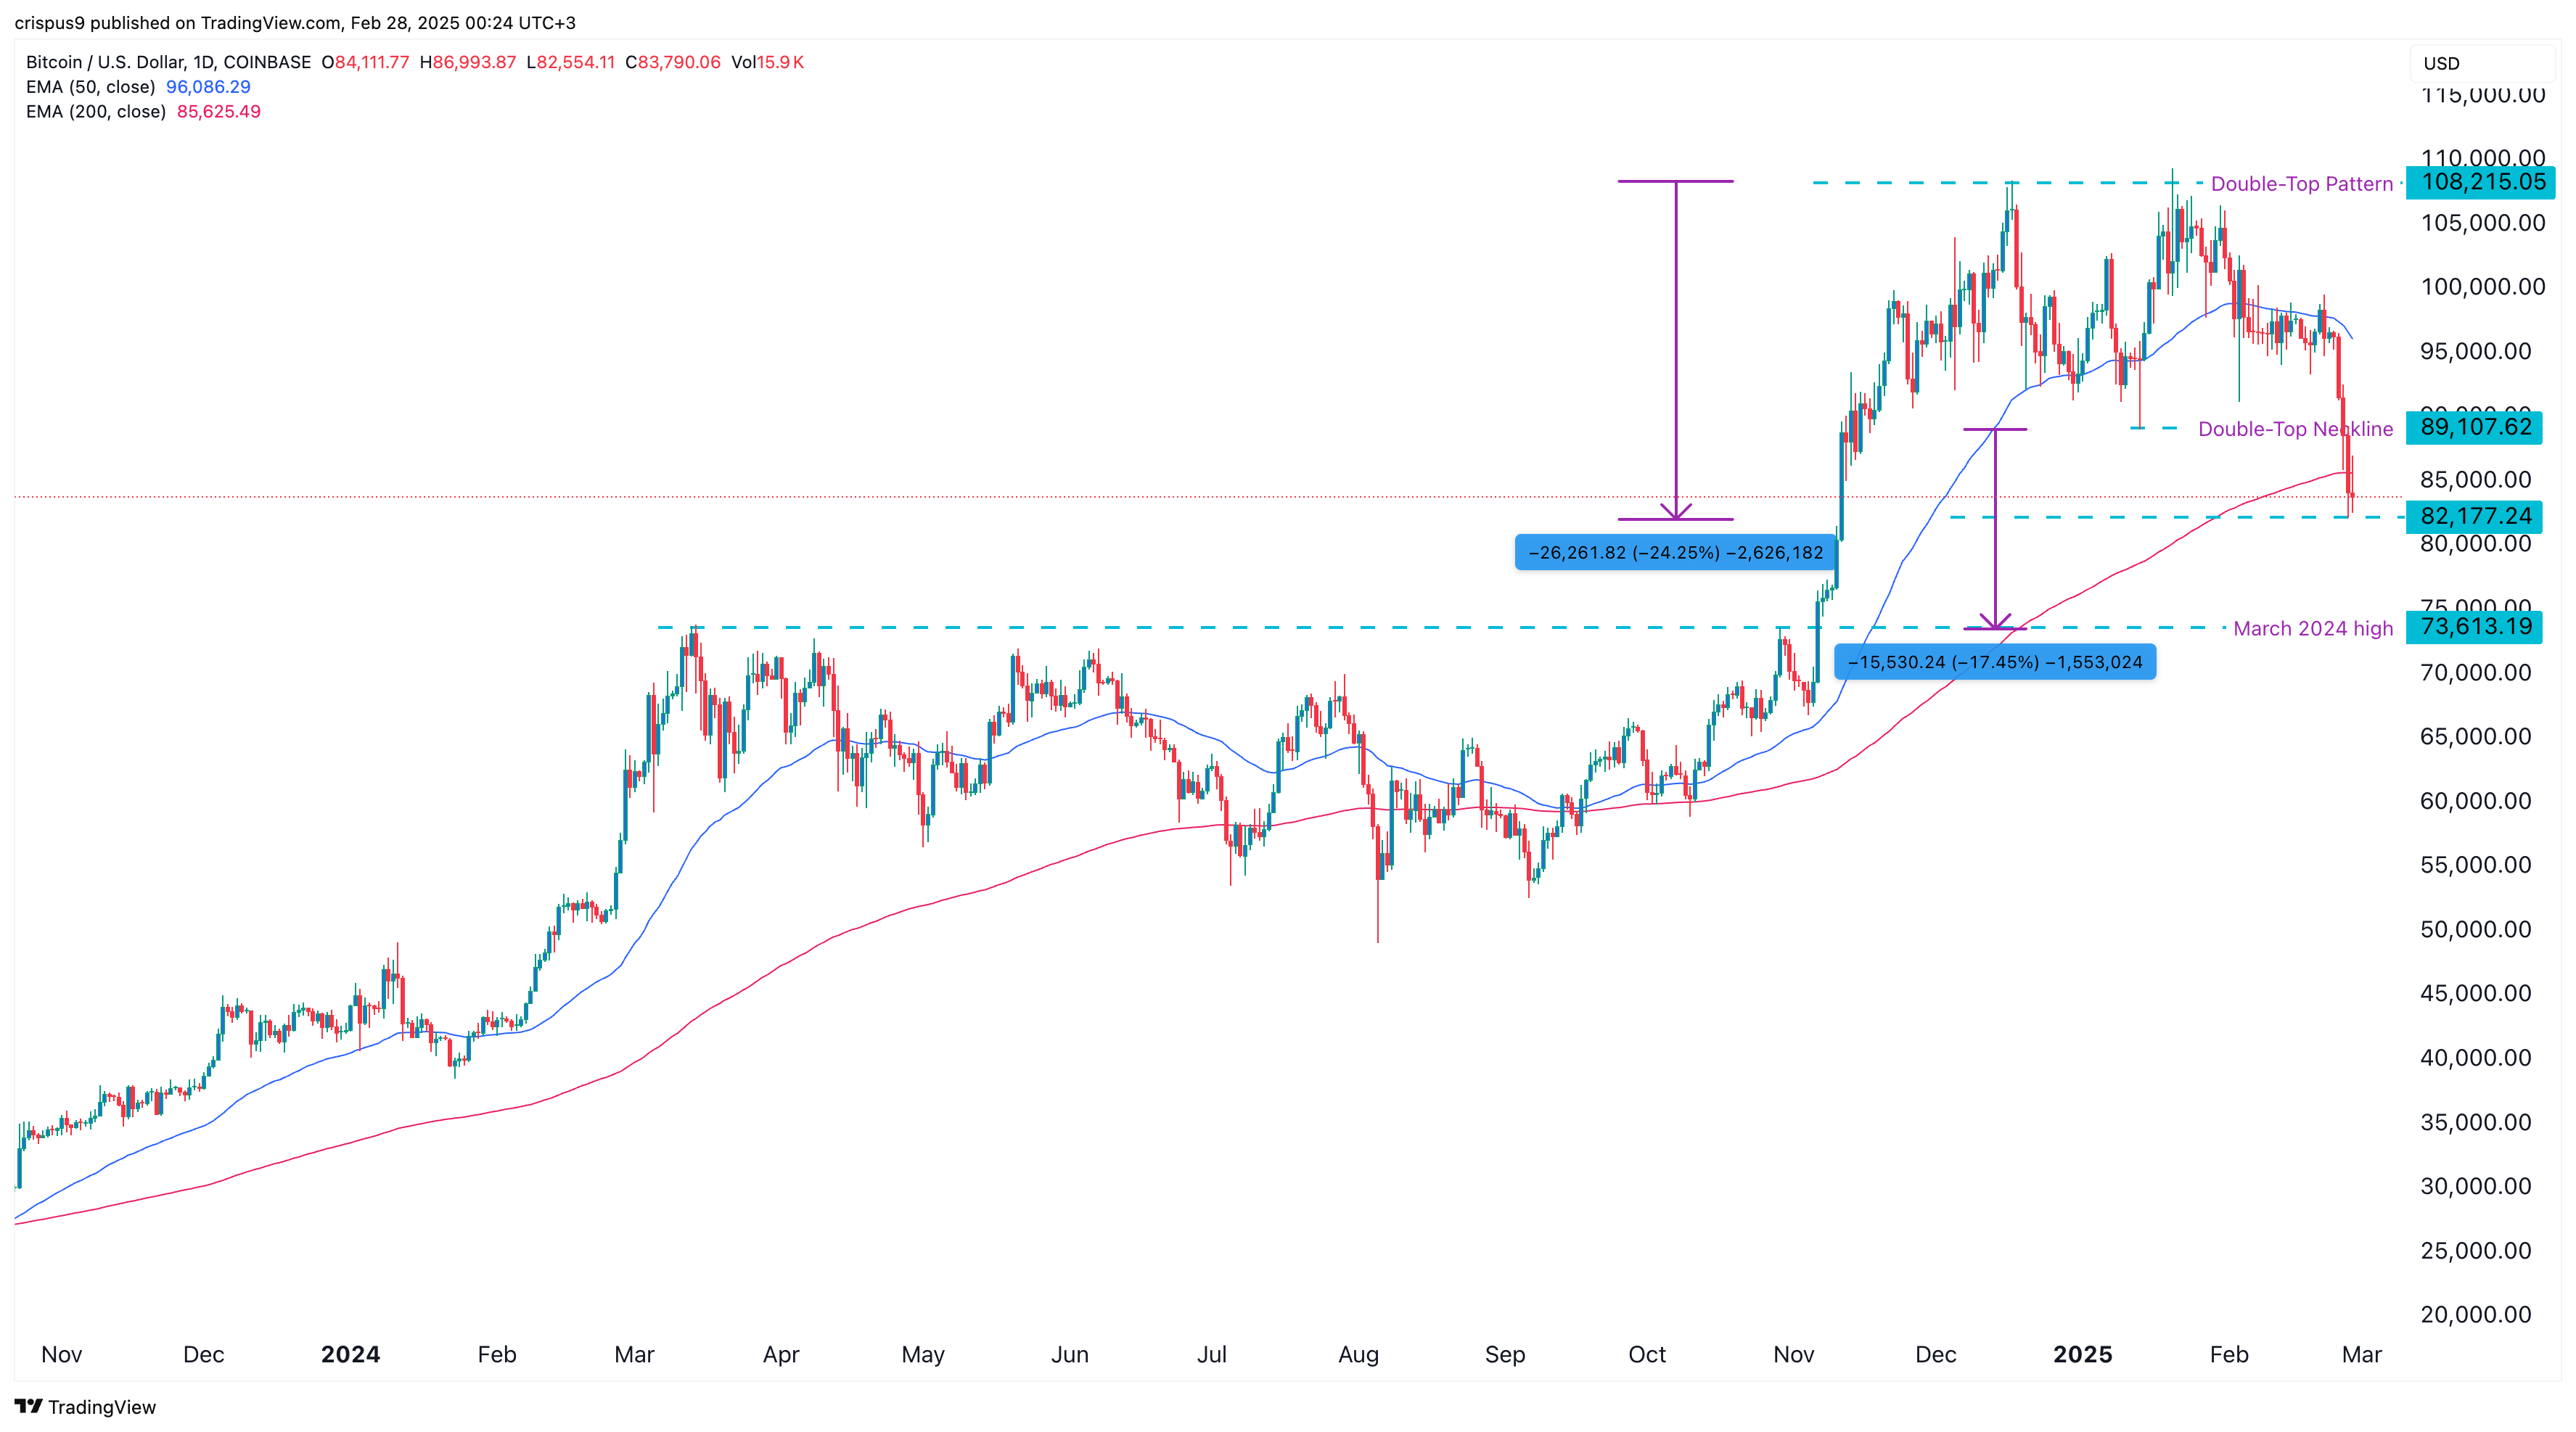
Bitcoin has a bearish outlook after the S&P 500 index flashed a sell signal this week. The coin has already crashed below $89,100, its lowest swing on January 13 and the neckline of the double-top pattern at $108,215. A double–top is another highly bearish pattern in the market.
The BTC price has also plunged below the 200-day Exponential Moving Average (EMA), a sign that bears are in control. Therefore, the most likely BTC price forecast is bearish, with the next key support level being at $73,615, the highest level in March 2024.
ADA Price Prediction
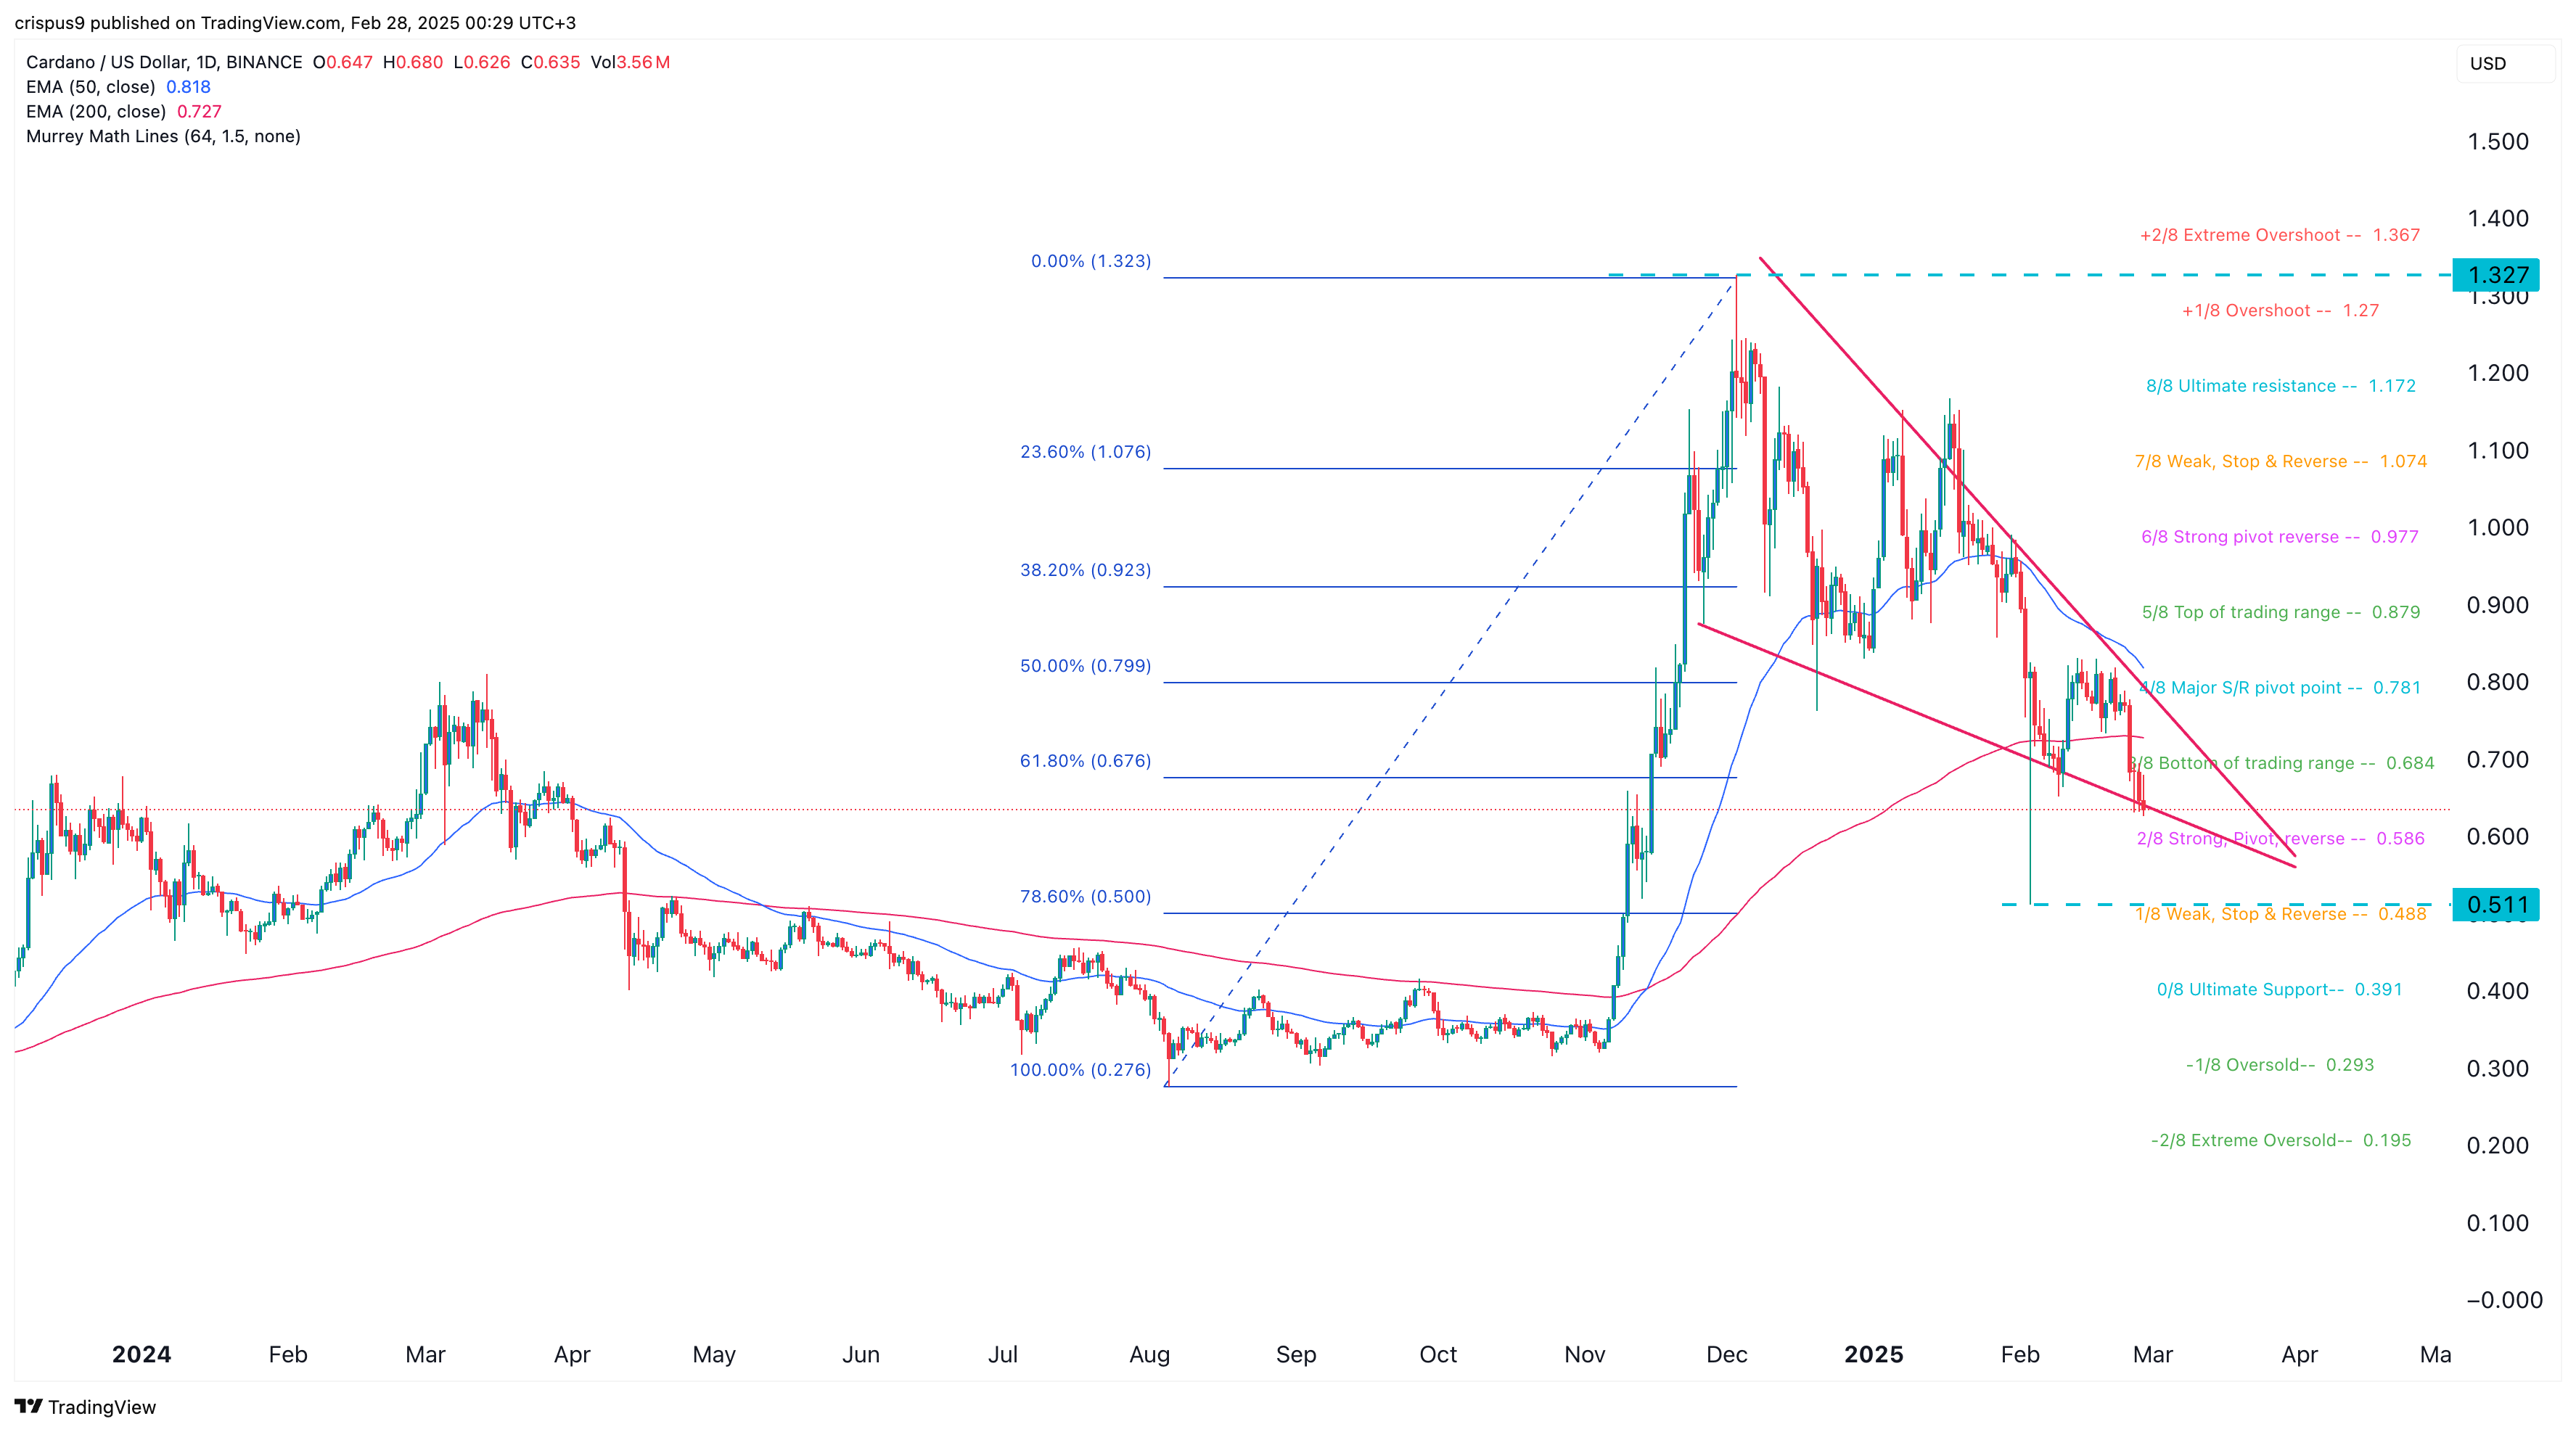
Cardano price has dropped sharply in the past few months, moving from $1.327 in November to $0.635. It has moved below the 61.8% Fibonacci Retracement level and the 50-day and 200-day EMA. It also dropped below the bottom of the trading range of the Murrey Math Lines.
On the positive side, Cardano’s price has formed a falling wedge pattern, which is a popular bullish reversal sign. That is a sign that, while the outlook remains bearish, it might bounce back soon. A potential catalyst would be the approval of a spot Cardano ETF.
XRP Price Analysis
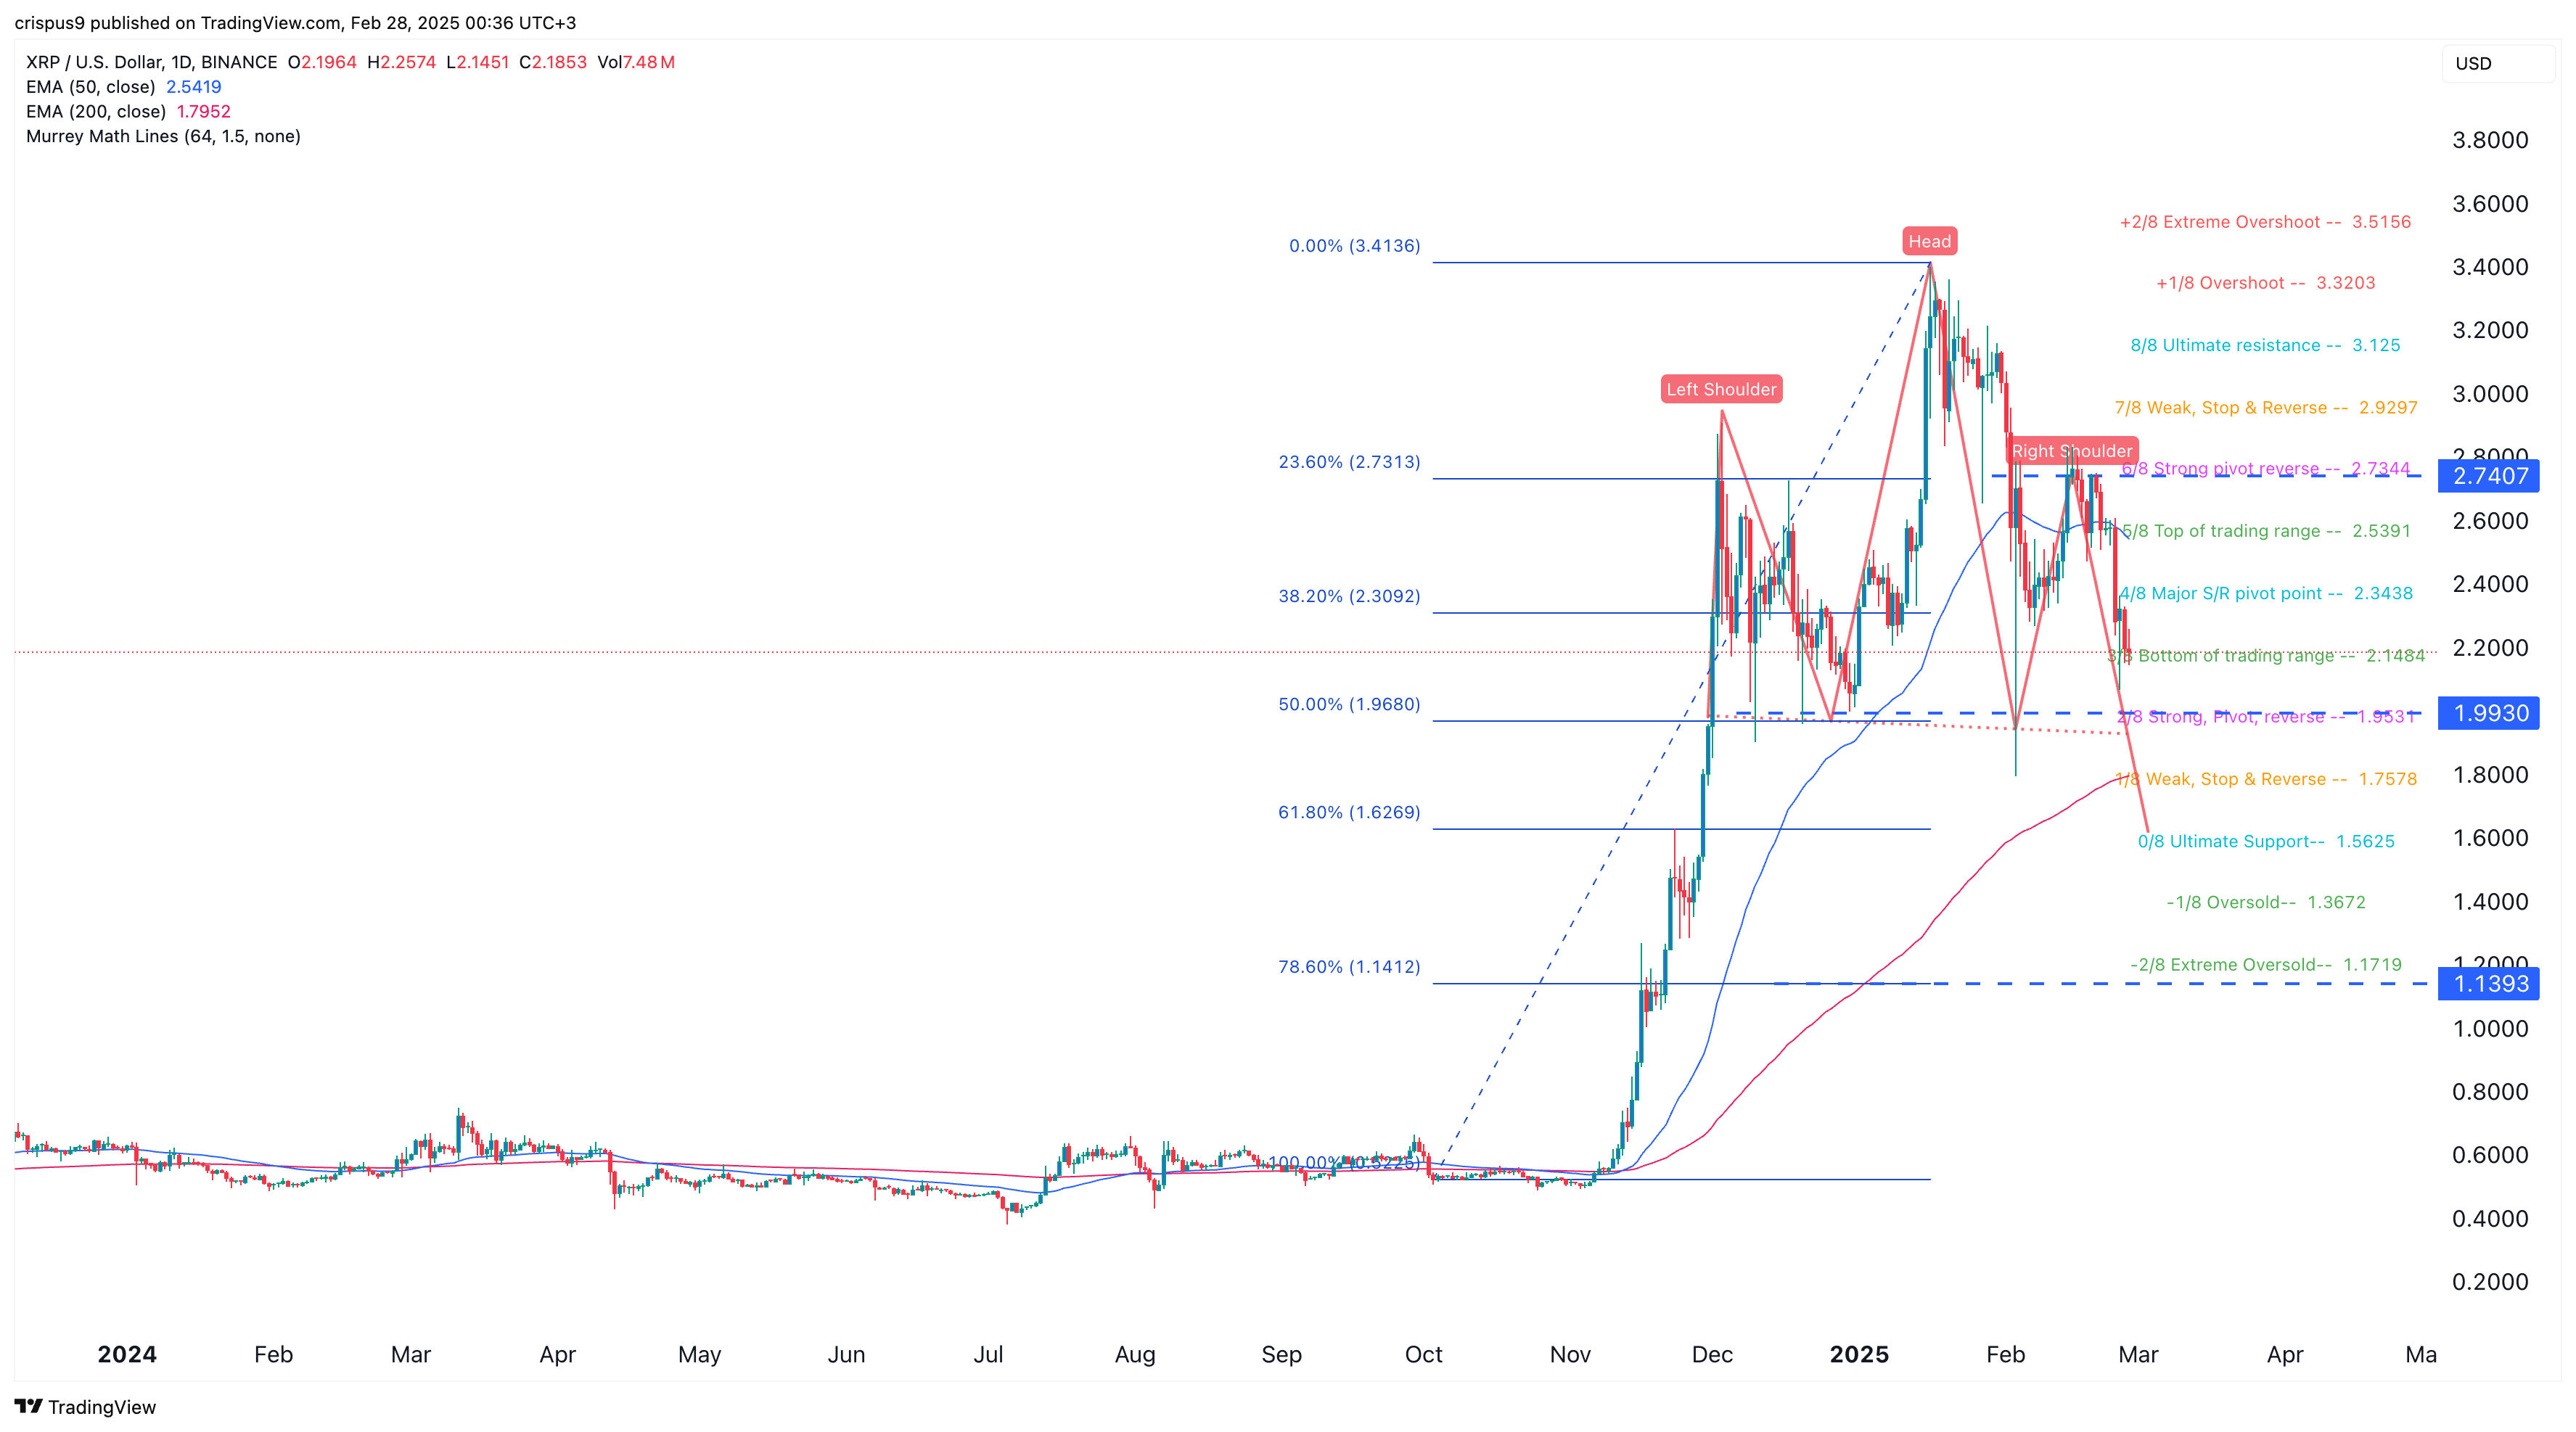
The most likely XRP price prediction is bearish now that it has formed a head-and-shoulders pattern with a neckline at $2. An H&S pattern consists of a head, two shoulders, and a neckline.
In most cases, a bearish breakdown happens when an asset drops below the neckline at $2. Such a move would point to the next support at $1.62, the 61.8% retracement level. A move above the resistance at $2.4, the major S&R point of the Murrey Math Lines, will invalidate the bearish outlook.
Summary
The ongoing S&P 500 index crash will likely be a negative catalyst for other risky assets because it will lead to an exodus to safe-haven assets. This means that cryptocurrency prices will remain volatile, with many continuing their downward momentum.
On the positive side for crypto, a Bitcoin price crash to $73,680 will be a bullish sign since it will be a sign of a break-and-retest pattern.
READ MORE: Why Is the Pi Network Price Soaring?