


The XRP Price has plummeted in the past few weeks, moving from the year-to-date high of $3.3950 to the current $2.40. Ripple’s crash happened as the crypto fear and greed index moved to the fear zone and as Bitcoin moved to a bear market. The XRP coin has several catalysts ahead, but a head-and-shoulders pattern points to more downside.
XRP Price Has Key Catalysts
The XRP coin price has numerous catalysts that may push it higher in the longer term. First, there are signs that the Securities and Exchange Commission (SEC) will end its appeal with Ripple Labs. That’s because the agency has already withdrawn cases against companies such as OpenSea, Uniswap, and Coinbase.
Second, there are rising odds that the agency will also agree to a spot Ripple ETF later this year. Such approval, according to JPMorgan analysts, will likely lead to over $8 billion in inflows in the first year.
Further, the XRP Price will likely benefit from the ongoing adoption of Ripple in Japan, where it is estimated that over 80% of local banks will embrace its technology in the coming months. Most of this growth will come from SBI Holdings, which has been using Ripple to make money transfers. More Japanese banks will do the same.
Ripple has other catalysts, such as the ongoing growth of the XRP Ledger network, which has attracted developers like Sologenic and Coreum. The RLUSD stablecoin has grown so that it is handling over $238 million in daily transactions.
Ripple Price Prediction
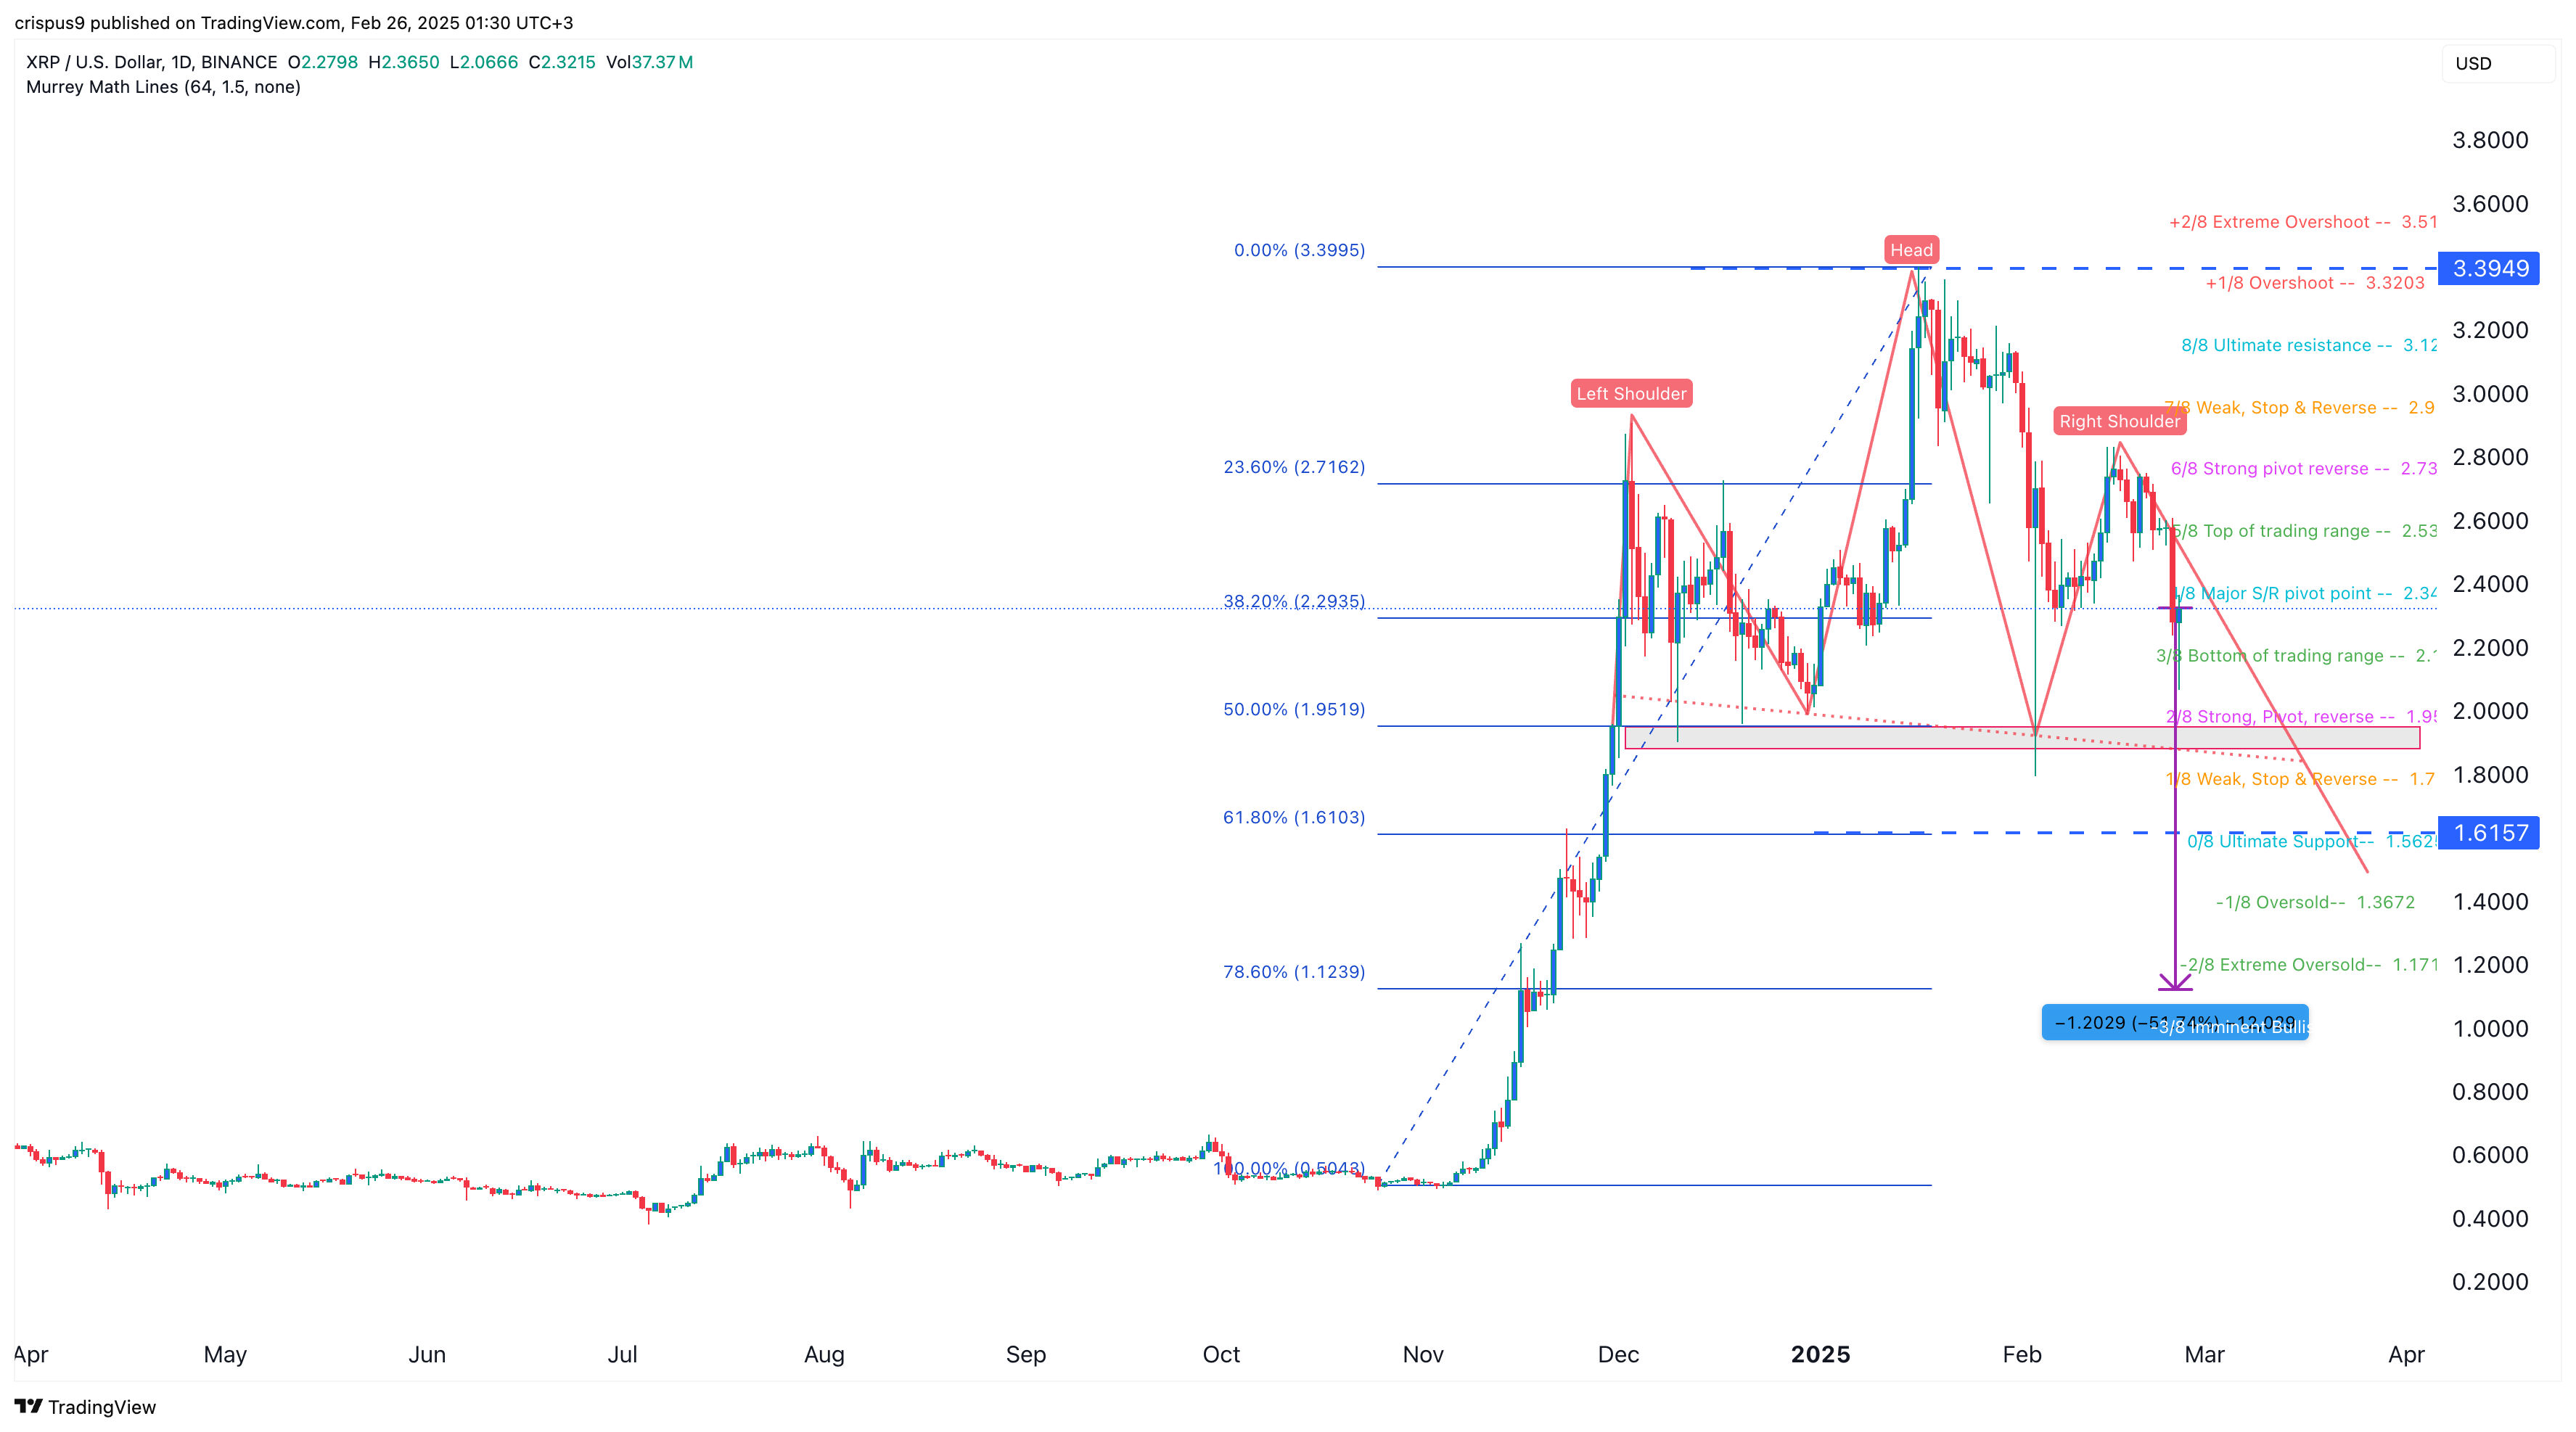
The daily chart shows that the XRP Price has crashed in the past few weeks. It has dropped from $3.40 in January to $2.40 today and has moved below the 50-day and 100-day Exponential Moving Averages (EMA).
Ripple has formed a head-and-shoulders pattern, with its neckline around the $2 support level. An H&S pattern is one of the most bearish chart patterns in the market.
Therefore, a drop below that neckline will point to more downside, potentially to $1.6, the 61.8% Fibonacci Retracement point that is also at the ultimate support of the Murrey Math Lines. This price is about 32% below the current level. A drop below that level will signal a crash to the 78.6% retracement at $1.1240, down by 50% below this level.
READ MORE: Should You Buy XRP Now? Analyst Van de Poppe Predicts Best Entry Points


