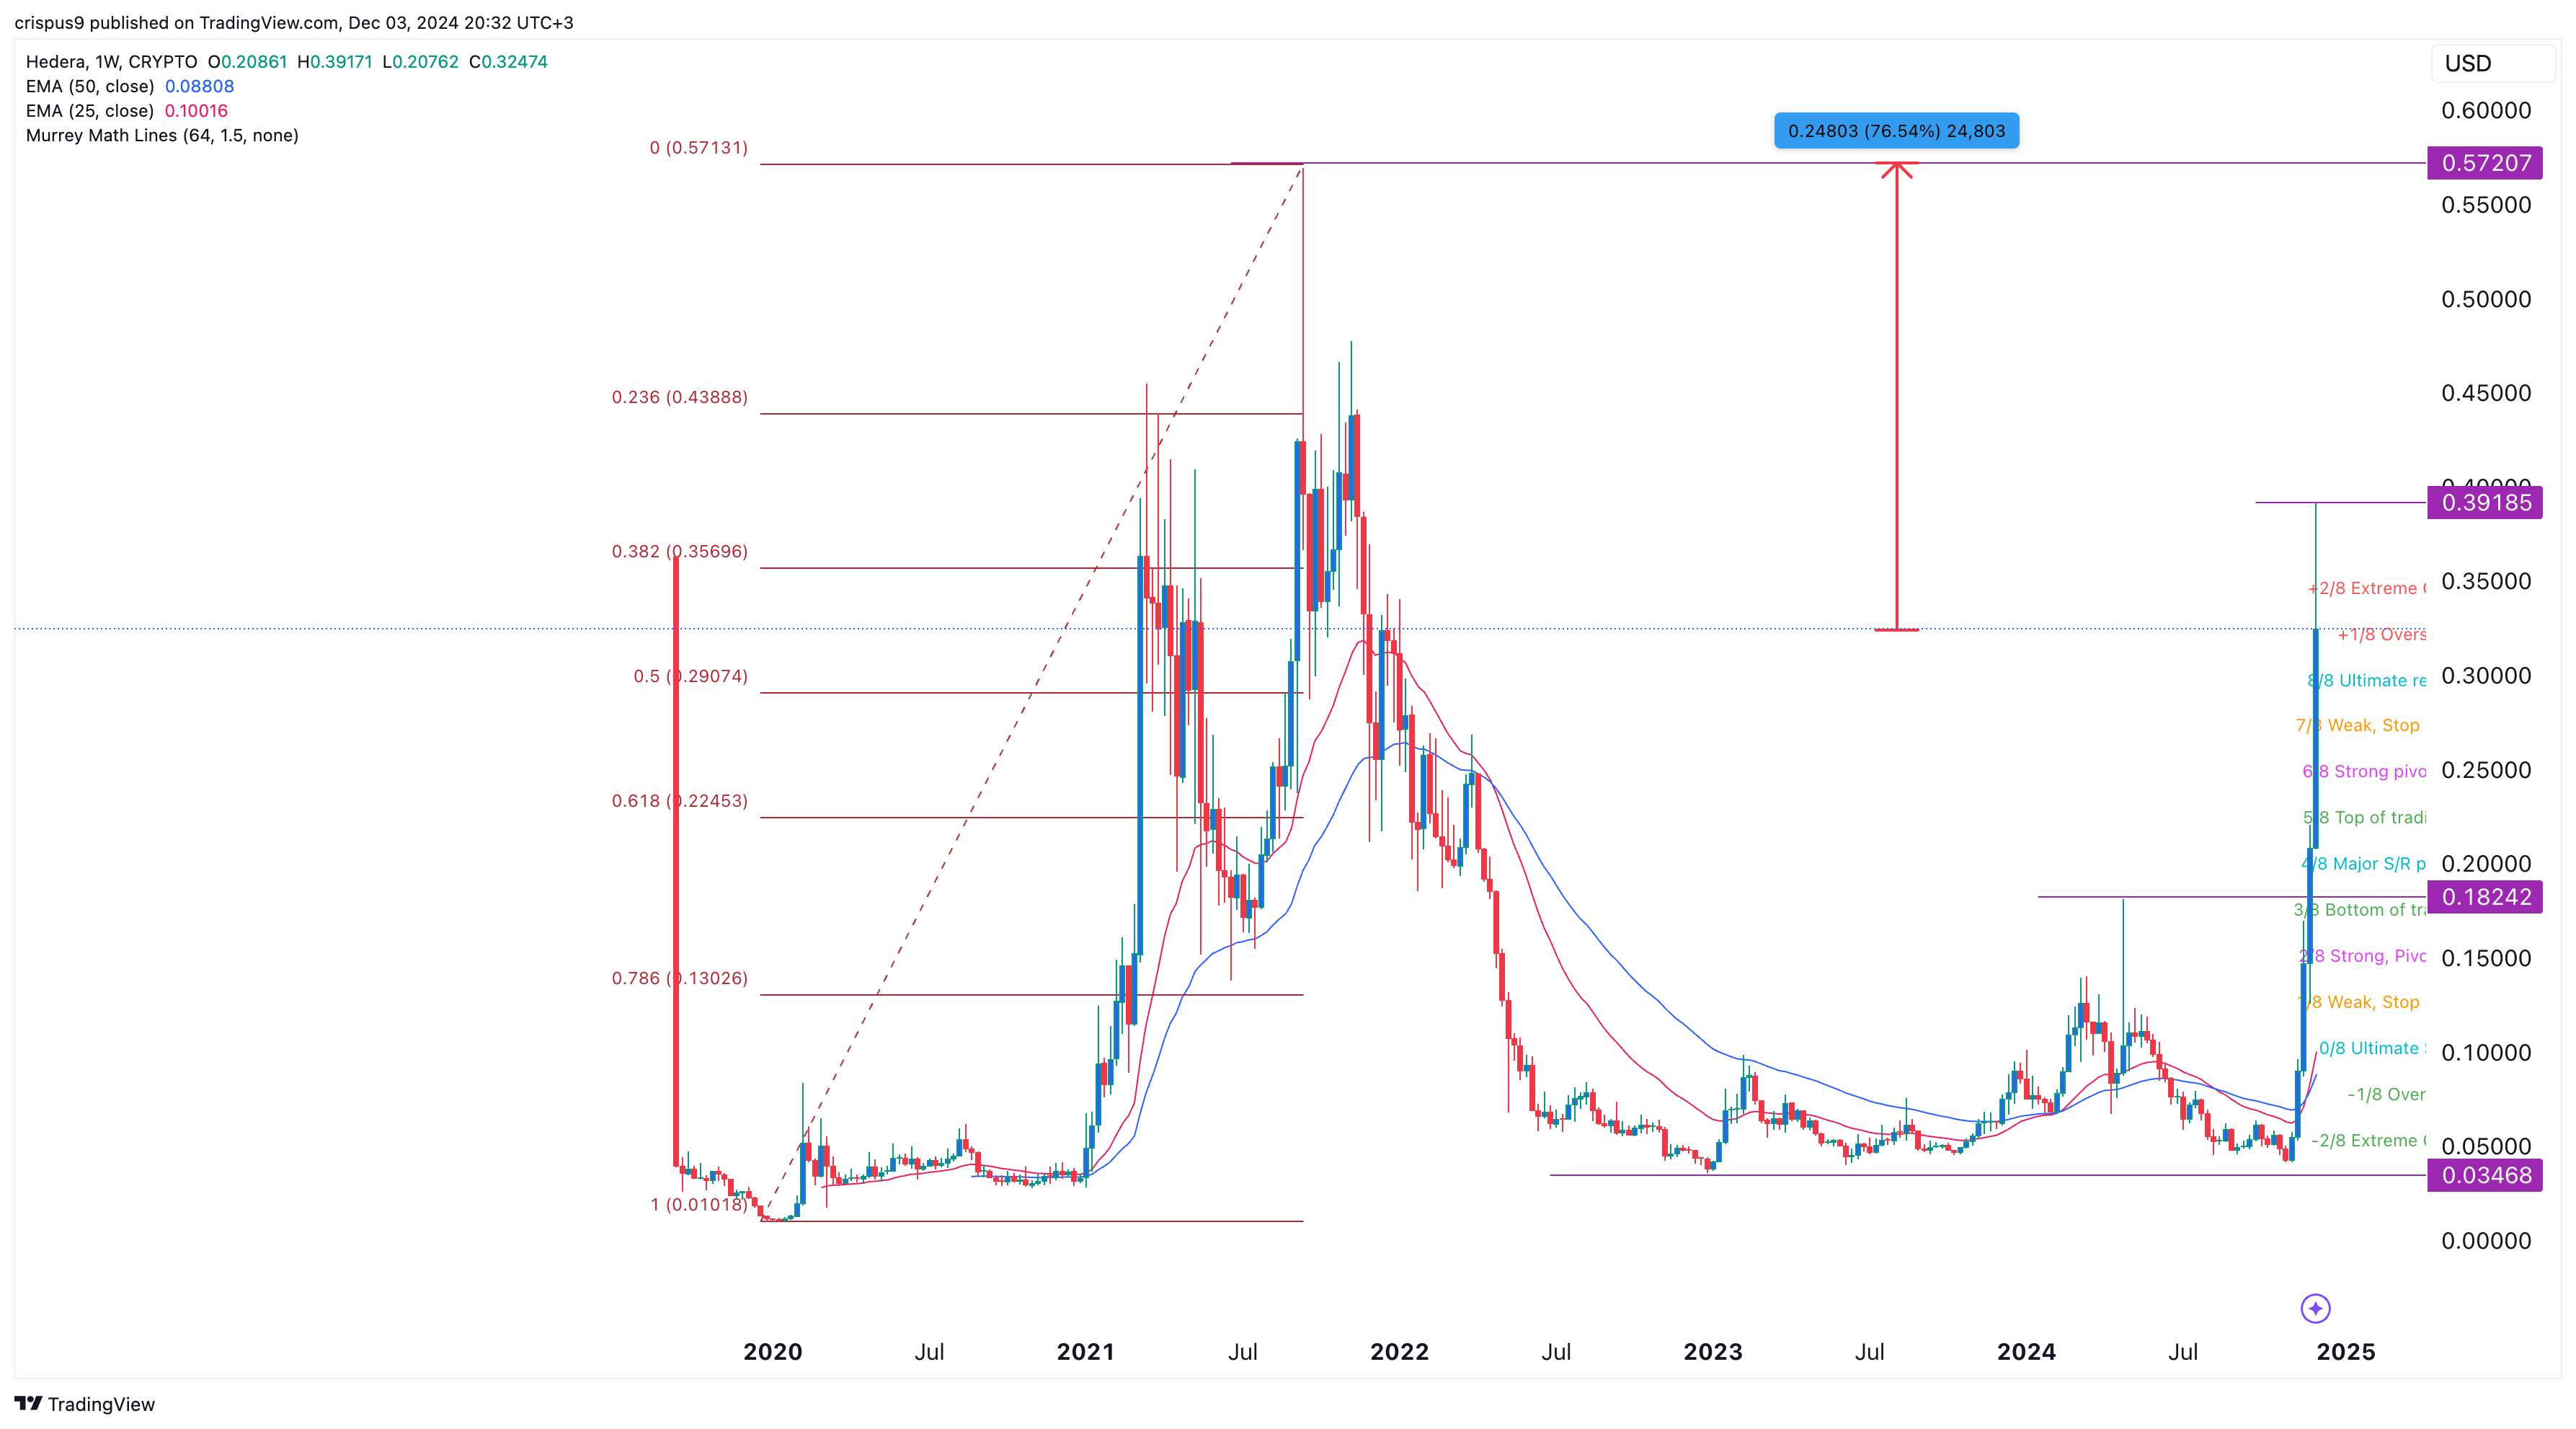
Hedera Hashgraph price has soared this week, reaching a high of $0.40, its highest level since November 2021. The HBAR token has risen for five consecutive weeks, its best-performance on record. Its market cap has jumped to over $12.9 billion, making it the 17th biggest coin in the industry.
Why is the Hedera Hashgraph rising
Hedera Hashgraph is one of the top layer-2 networks in the blockchain industry. It is an Ethereum-rival whose main difference is that its governance council is made up of some of the top companies globally like Ubisoft, Google, and IBM.
Hedera has better features than most layer-1 networks. For example, its network can handle thousands of transactions per second (tps) at minimal costs. Data by Arkhia shows that Hedera has now handled over 71 billion transactions since inception, a trend that is continuing.
Hedera Hashgraph price soared as investors moved back to traditional coins following the strong Ripple and Stellar rally. Most old coins like Zilliqa, IOTA, and VeChain have jumped in the ongoing altcoin season.
HBAR price has also soared as investors brace for a potential spot HBAR ETF. Canary Capital, a small asset manager, has already filed for such a fund with the Securities and Exchange Commission (SEC). The hope is that the incoming Donald Trump administration will approve the fund since it has expressed support for the industry.
Read more: Here’s Why the IOTA Price Just Surged
Meanwhile, the Federal Reserve has expressed support for Dropp, a platform that enables micro transactions, which is built on top of Hedera’s technology.
There are signs that other parts of Hedera’s network are growing as the total value locked (TVL) in the DeFi ecosystem jumped to a record high of $191 million. Its stablecoin market cap has risen to over $20.5 million.
Can the HBAR price cross $5?

Shawn, a popular crypto analyst, predicted that the Hedera Hashgraph price would jump to $5 in the long term and $2.50 in the near term. To achieve the lower side of his estimate, the HBAR token needs to rise by 657%.
These are huge numbers since the S&P 500 index has jumped by less than 200% in the last decade. However, this performance is possible in the crypto industry, as we have seen with XRP and XLM, which have jumped by almost 500% in the last 30 days.
Looking at Hedera’s weekly chart, we see that it formed a triple-bottom pattern at $0.03468. It failed to move below that level since January 2023. The coin has now moved above the pattern’s neckline at $0.1842.
It has moved above the 50-week and 25-week Exponential Moving Averages (EMA). Also, it has jumped above the overshoot level of the Murrey Math Lines. Also, it is between the 50% and 38.2% retracement level.
Therefore, it is still too early to determine whether the HBAR price will get to $1, let alone $5, for now. The most realistic Hedera forecast is where the coin rises and retests the all-time high at $0.5720, which is about 76% above the current level. The stop-loss of this trade is at $0.18.25.


