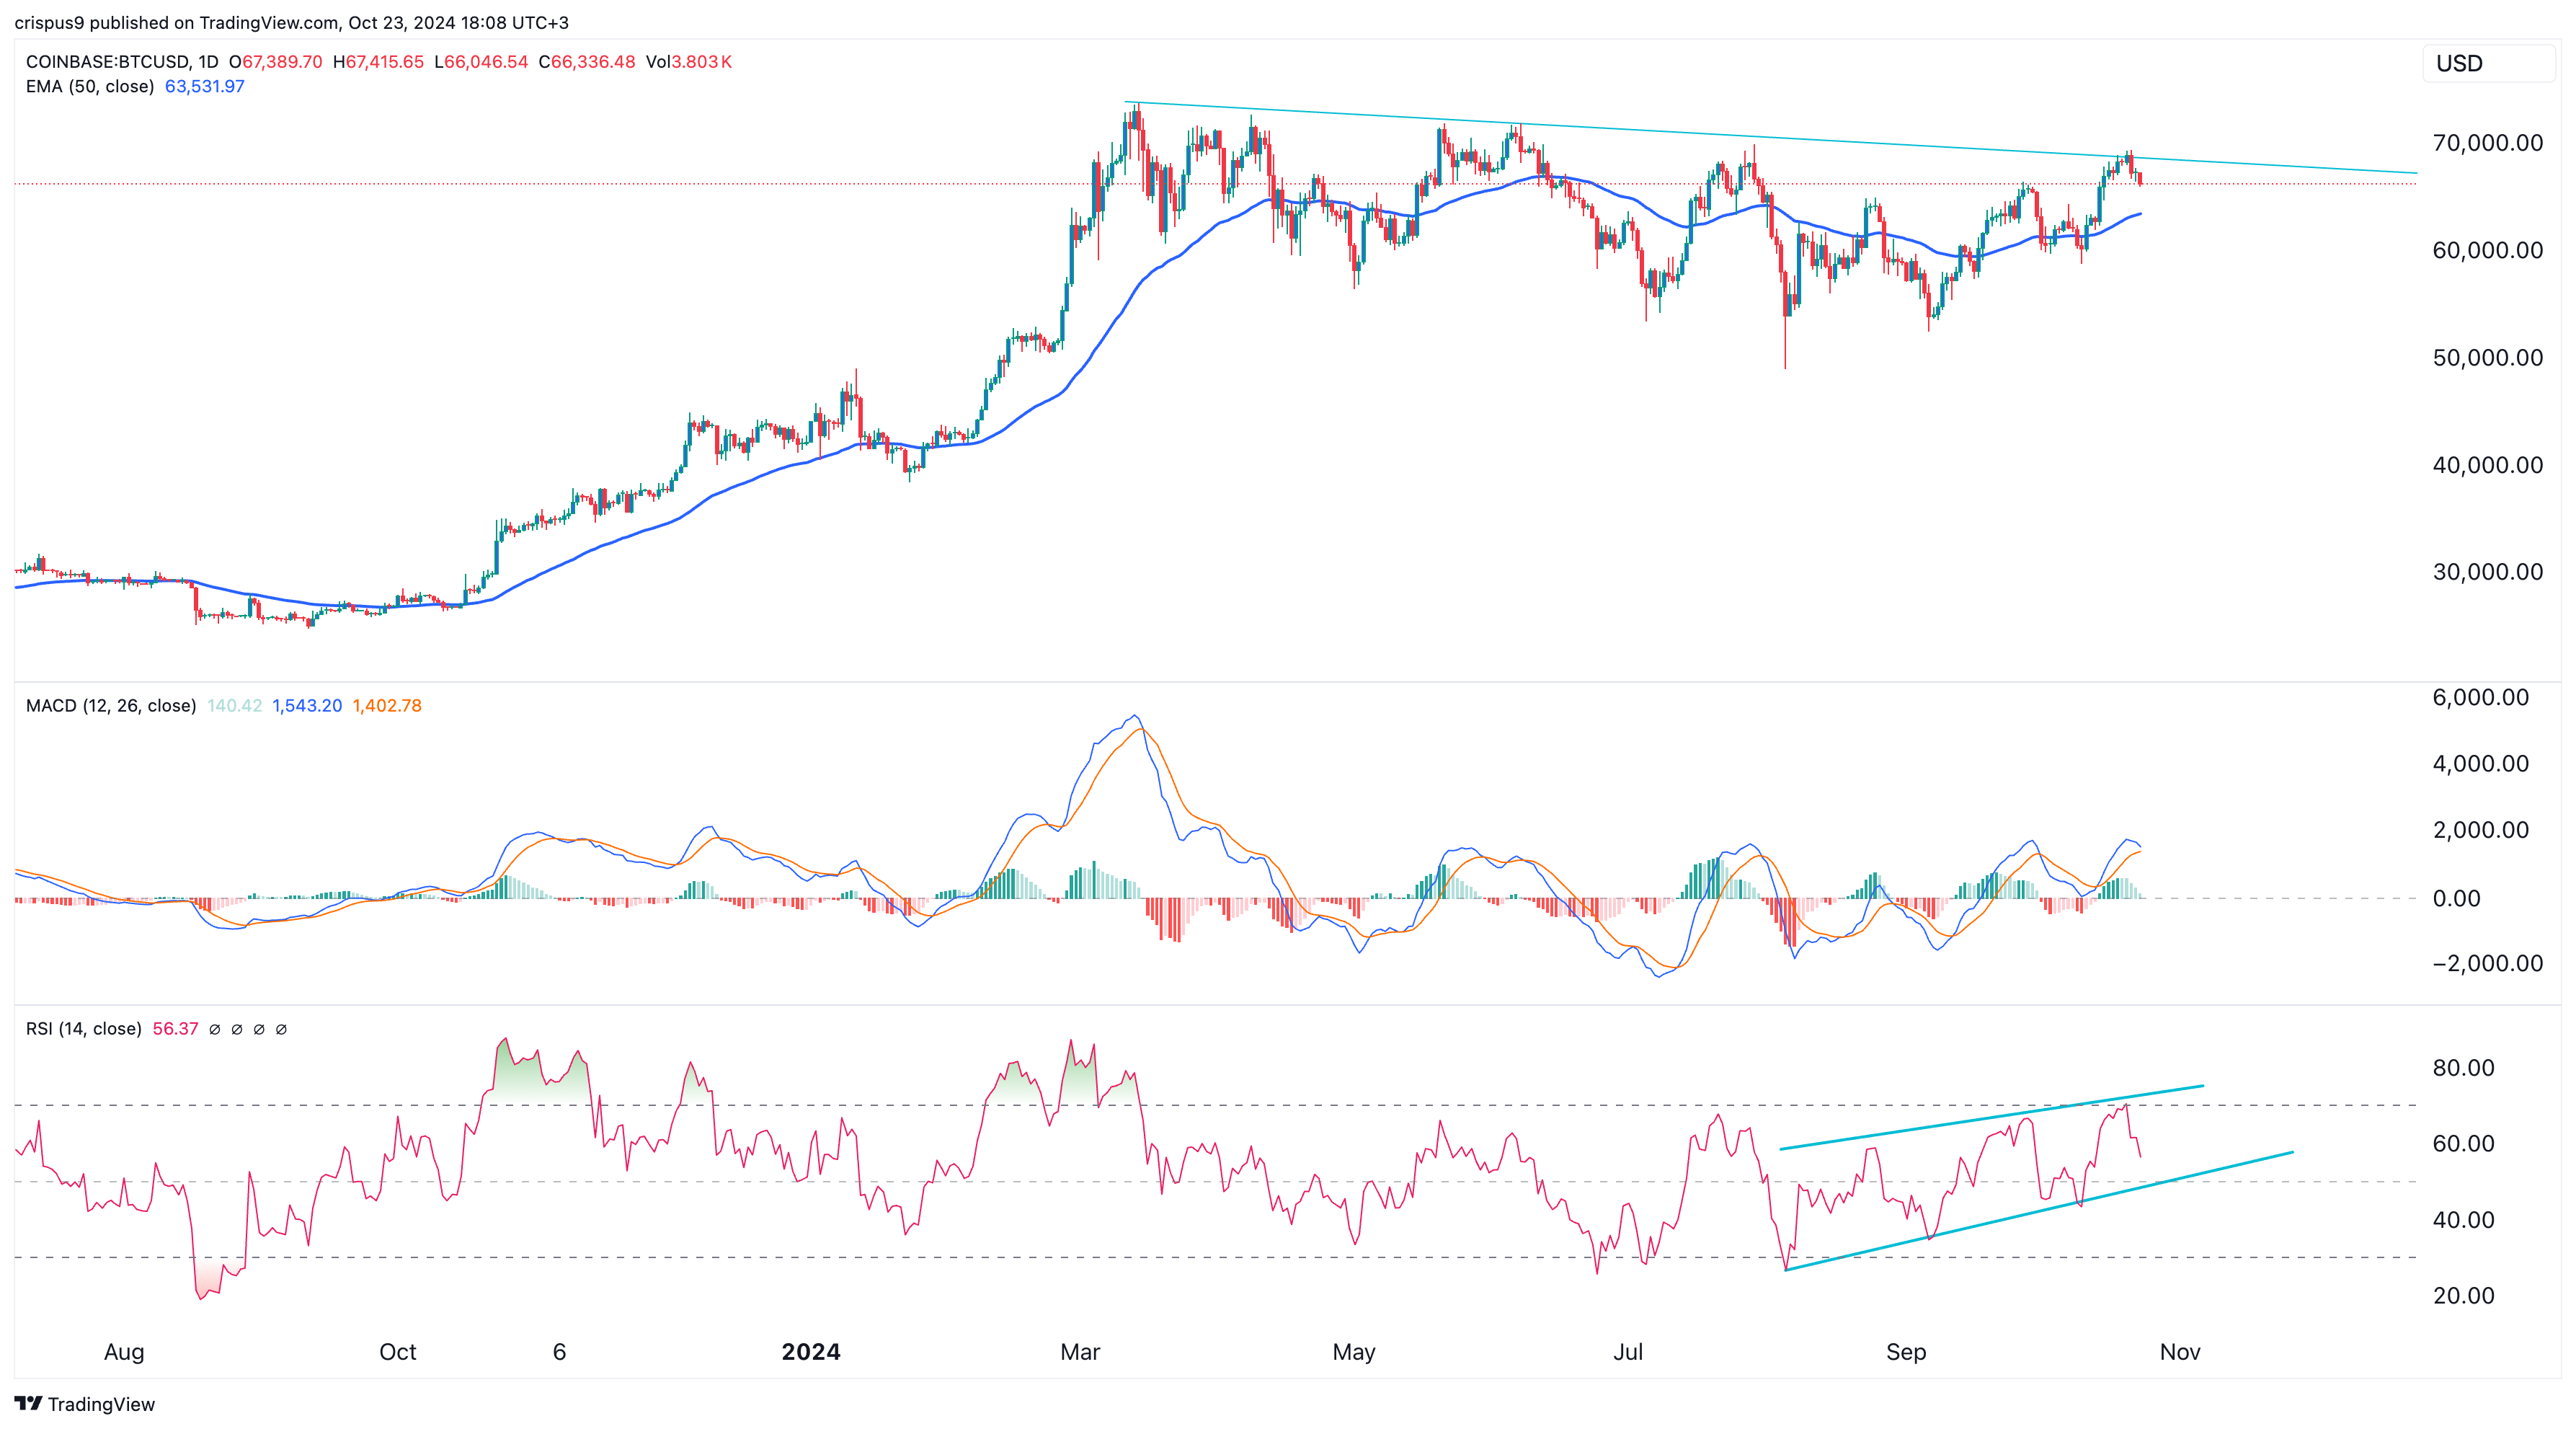
Bitcoin price continued its downward trend on Wednesday as the fear and greed index moved from the greed zone to 56. It retreated to $66,500, much lower than this week’s high of $69,300.
Wall Street is bullish on Bitcoin
There are signs that many Wall Street analysts have become highly bullish on Bitcoin prices. In a note on Wednesday, analysts at Bernstein, a company with $725 billion in assets under management (AUM) predicted that the coin will jump to $200,000 by 2025. Such a move means that the coin will rise by 200% from the current level.
Bernstein is not the only major Wall Street player bullish on Bitcoin. In a recent White Paper, Blackrock, a company with over $11 trillion in assets, said that Bitcoin was one of the best diversifiers. The company has continued buying the coin in the past few months.
Read more: Jasmy Price Prediction: Mixed Signals, But a Breakout Likely
Meanwhile, Standard Chartered, a leading bank with $822 billion in assets, has predicted that the coin will surge to $125,000 if Donald Trump wins the general election. Paul Tudor Jones, a popular billionaire has also made a bullish Bitcoin forecast, citing the rising inflation.
More data shows that 1,179 institutions have invested in spot Bitcoin ETFs, including the biggest hedge funds in globally. Some of the most notable ones are Millenium Management, Susquehanna, Jane Street, Capula, and D.E Shaw.
Most of these funds see Bitcoin as an uncorrelated asset, which often move in the opposite direction as American stocks. It also has a good record of beating stocks and gold. For example, it has risen by almost 60% this year, while the S&P 500 and Dow Jones have risen by less than 25%.
There is still significant demand for Bitcoin ETFs as the cumulative inflows jumped to over $21.1 billion.
Bitcoin price analysis

The daily chart shows that Bitcoin has held steady in the past few days. This retreat happened after the coin rose and hit the descending trendline that connects the highest levels since March 14. This price is also the upper side of the falling broadening wedge chart pattern, a popular bullish sign.
Bitcoin has formed a golden cross as the 50-day and 200-day Weighted Moving Averages (WMA) have formed a bullish crossover pattern. In most periods, this is one of the most bullish patterns in the market.
Bitcoin’s oscillators are also supportive, with the MACD and the Relative Strength Index (RSI) pointing upwards. Therefore, the coin will likely continue soaring as bulls target the all-time high of $73,800.
Read more: Ripple News: XRP Price Prediction as Dark Clouds Form


