


Pepe price has performed well over the past few weeks, rising for three consecutive weeks. This trend could persist if Ethereum experiences a breakout soon. Pepe Coin approached the key resistance at $0.000010 last week and has jumped by over 70% from its monthly low. This article examines how high the Pepe meme coin could rise if Ether reaches $2,500.
Ethereum Price Technical Analysis: Can it Hit $2,500?
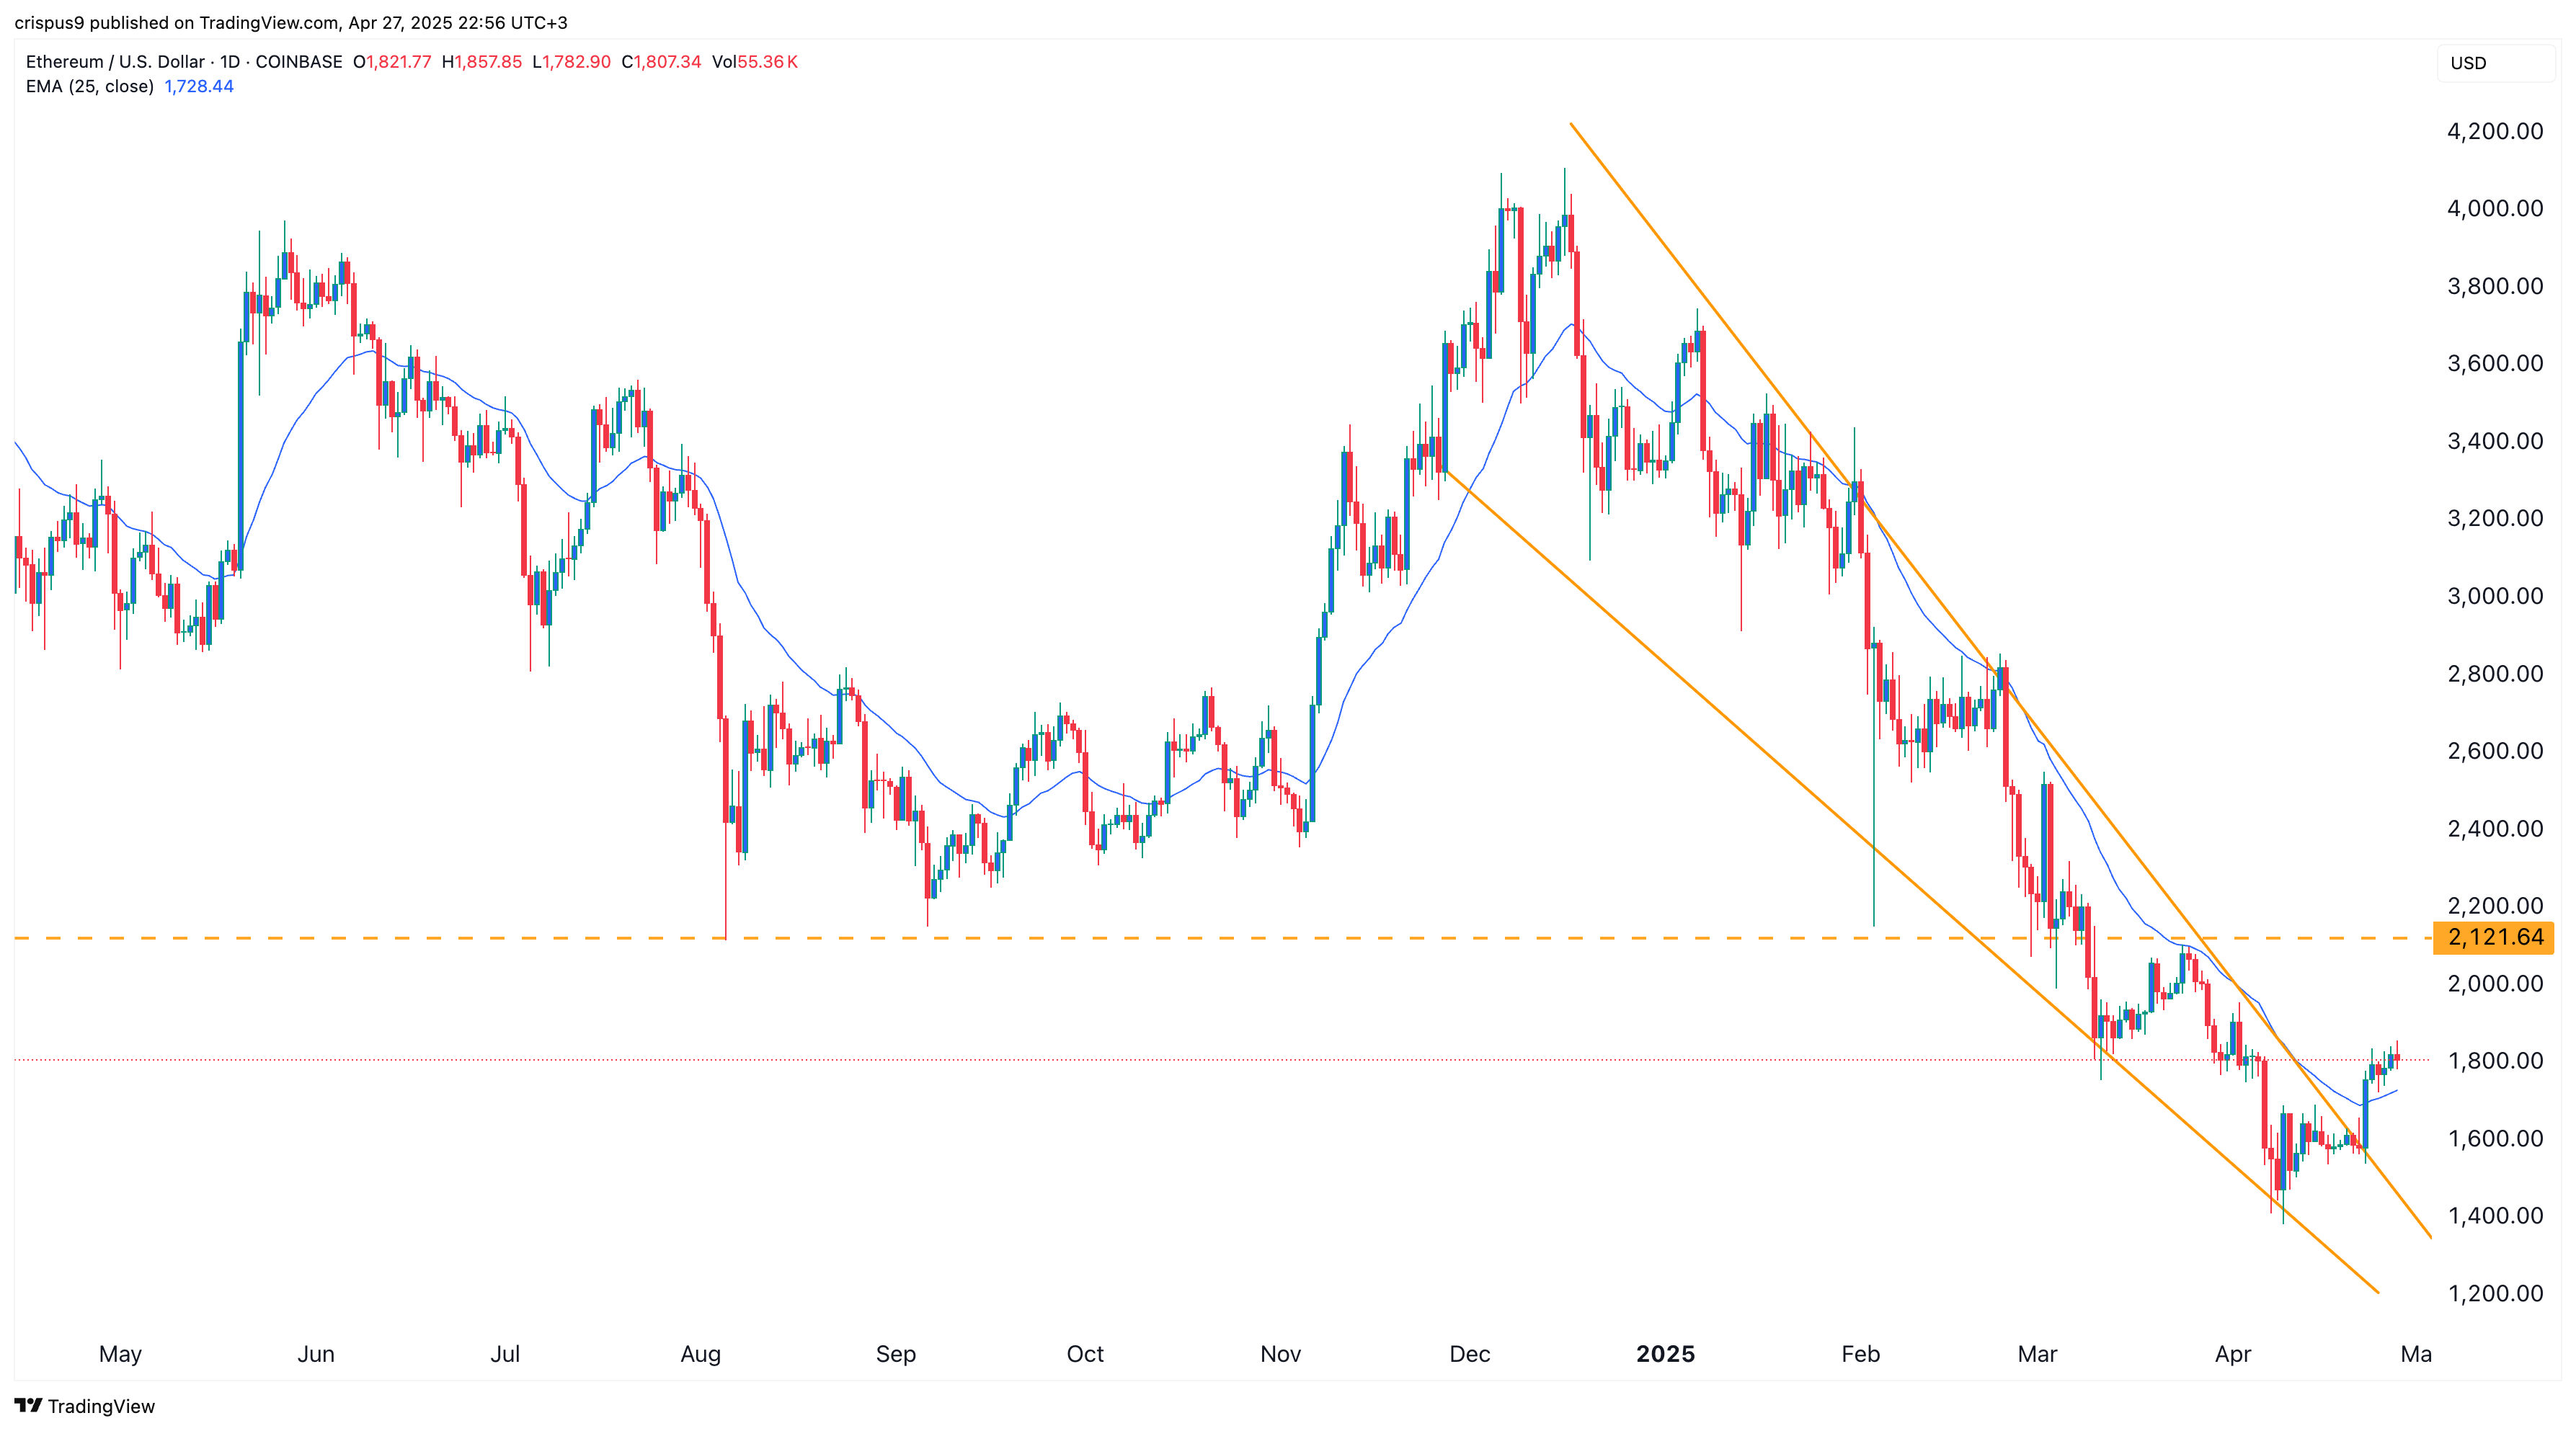
Technical indicators suggest that the ETH price may be on the cusp of a strong bullish breakout in the near term. It has formed a giant falling wedge chart pattern on the daily chart, and the two lines are about to converge.
Ethereum has already moved above the upper side of the falling wedge pattern, validating the bullish outlook. It has also moved above the 25-day Exponential Moving Average (EMA), indicating that bulls currently maintain control. The ETH price is also attempting to move above the 50-day moving average.
Most notably, it has recently formed a small bullish flag chart pattern. Therefore, there is a likelihood that the ETH price will continue rising, with an initial target set at the significant psychological level of $2,000.
Subsequently, the next level to monitor is $2,120, which serves as the neckline of the larger triple-top pattern visible at $4,100 on the weekly chart. A breakout beyond this could lead to further gains, potentially reaching the psychological $2,500 milestone.
READ MORE: Ethereum Price ‘Doubled in Weeks’ the Last Time it Did This
Pepe Price Prediction if ETH Hits $2,500
At times, meme coins in a specific chain tend to perform well when the chain’s native token is thriving. For example, the recent Solana price rally occurred as meme coins such as Bonk (BONK), Dogecoin, and Pudgy Penguins rose.
The daily chart below shows that the price of Pepe has rebounded over the past few days. This recovery occurred after the coin formed a double bottom pattern at $0.000005740 earlier this month. It is now hovering at the neckline of this pattern.
The price of Pepe Coin has risen above the 25-day moving average. It has also formed a giant double-bottom pattern at $0.0000058, with the neckline positioned at $0.00002840.
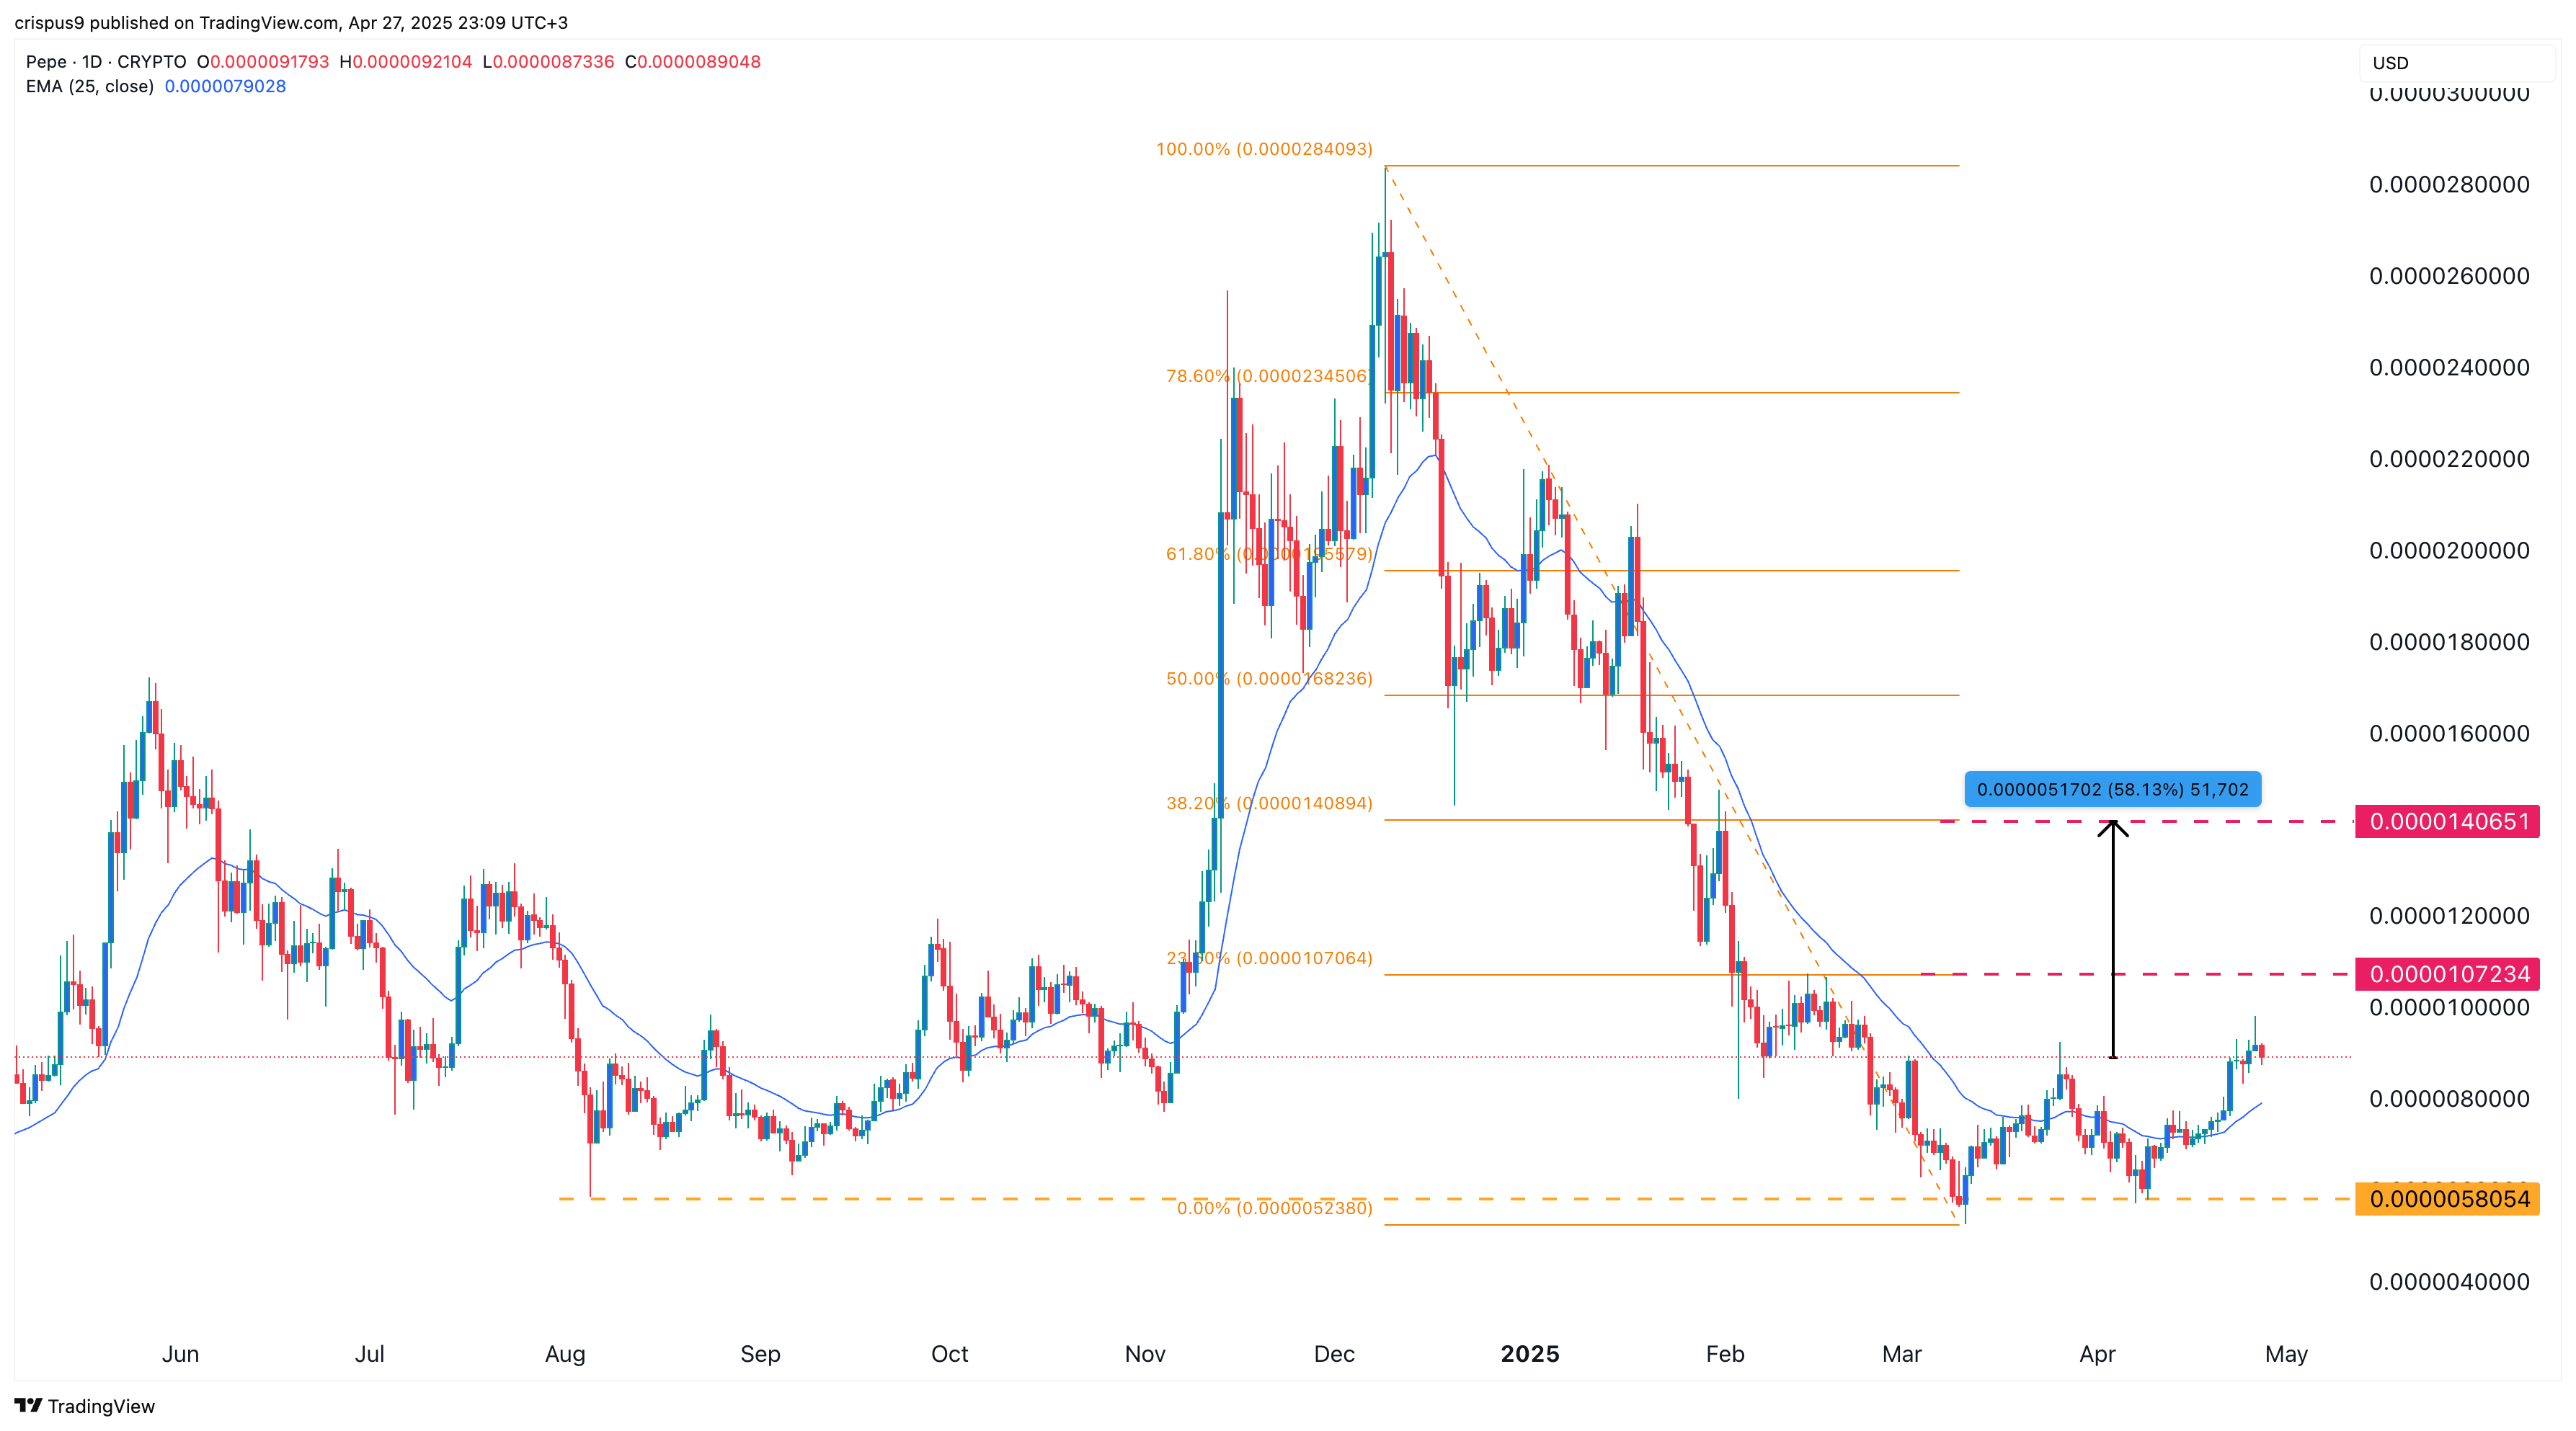
Therefore, the coin is most likely to rise initially to the 23.6% Fibonacci Retracement level at $0.00001072, approximately 20% above its current value. If it moves above this level, further upside is expected, with the initial target set at $0.000014, representing a nearly 60% increase from the current level.
READ MORE: ProShares to Launch 3 XRP Futures ETFs by April 30