


The Ethereum price (ETH) is hovering around the $1,615 mark after a significant correction from its 2024 highs. Market watchers are split between calling this a golden buying opportunity and the beginning of a deeper cycle low.
Based on technical patterns, historical metrics, and on-chain sentiment shared by top crypto analysts, Ethereum could set up for a meaningful long-term rebound — but only if it holds a critical support range.
As of the time of writing, the ETH price is trading at $1,614.93, a 1.66% increase over the past 24 hours. However, when viewed over longer periods, the numbers paint a more bearish picture: down by over 21% in the past month, 41% in the past six months, and a steep 51% drop year-to-date, according to TradingView.
With Ethereum (ETH) underperforming the broader market and testing key levels, the spotlight is back on whether ETH is close to its cyclical bottom.
Analyst Predicts ETH Price Sweep Toward $1,100
Renowned crypto trader Heisenberg believes the Ethereum price is heading toward a cycle low, and he has been calling it since ETH traded above $3,500.
In a recent tweet, he pointed to a setup resembling past market movements, with prices deviating above previous highs before reversing and targeting major liquidity zones.
He expects ETH to sweep the 2022 cycle lows near $1,100, which he calls a prime buying opportunity. In his words: “Buy at 2022 cycle’s low sweep and SLEEP!”
The chart shared in his tweet reinforces this bearish-to-bullish reversal theory. It shows Ether forming a lower high and trending down toward the previous macro support of around $1,100, with clear signs of distribution at the top.
According to Heisenberg, this setup mirrors historical price behavior where a deviation is followed by a sweep of major demand zones, just before a new cycle begins.
MVRV Bands Flash a Rare Buy Signal
While some traders anticipate lower prices, others argue that Ethereum is already in a historically favorable accumulation zone. Analyst Ali (@ali_charts) shared a chart using MVRV (Market Value to Realized Value) pricing bands, which track Ethereum’s valuation relative to its historical average cost basis.
According to Ali, the best ETH buying opportunities have always occurred when the price dips below the lower MVRV band, and that’s exactly where ETH is right now.
The MVRV chart highlights past bottoms in 2019, 2020, and 2022, which coincided with the price touching or dipping under the lower bands. Ali believes the current drop presents a “value zone” — a long-term accumulation point that has historically preceded major rallies.
This view is supported by Glassnode’s on-chain pricing models, suggesting that, despite short-term volatility, Ethereum is undervalued compared to its long-term cost basis for holders.
Ethereum Price Technical Indicators
From a technical standpoint, Ethereum is at a critical crossroads. The weekly chart shows ETH attempting to hold above $1,600, with a current close of $1,611.22.
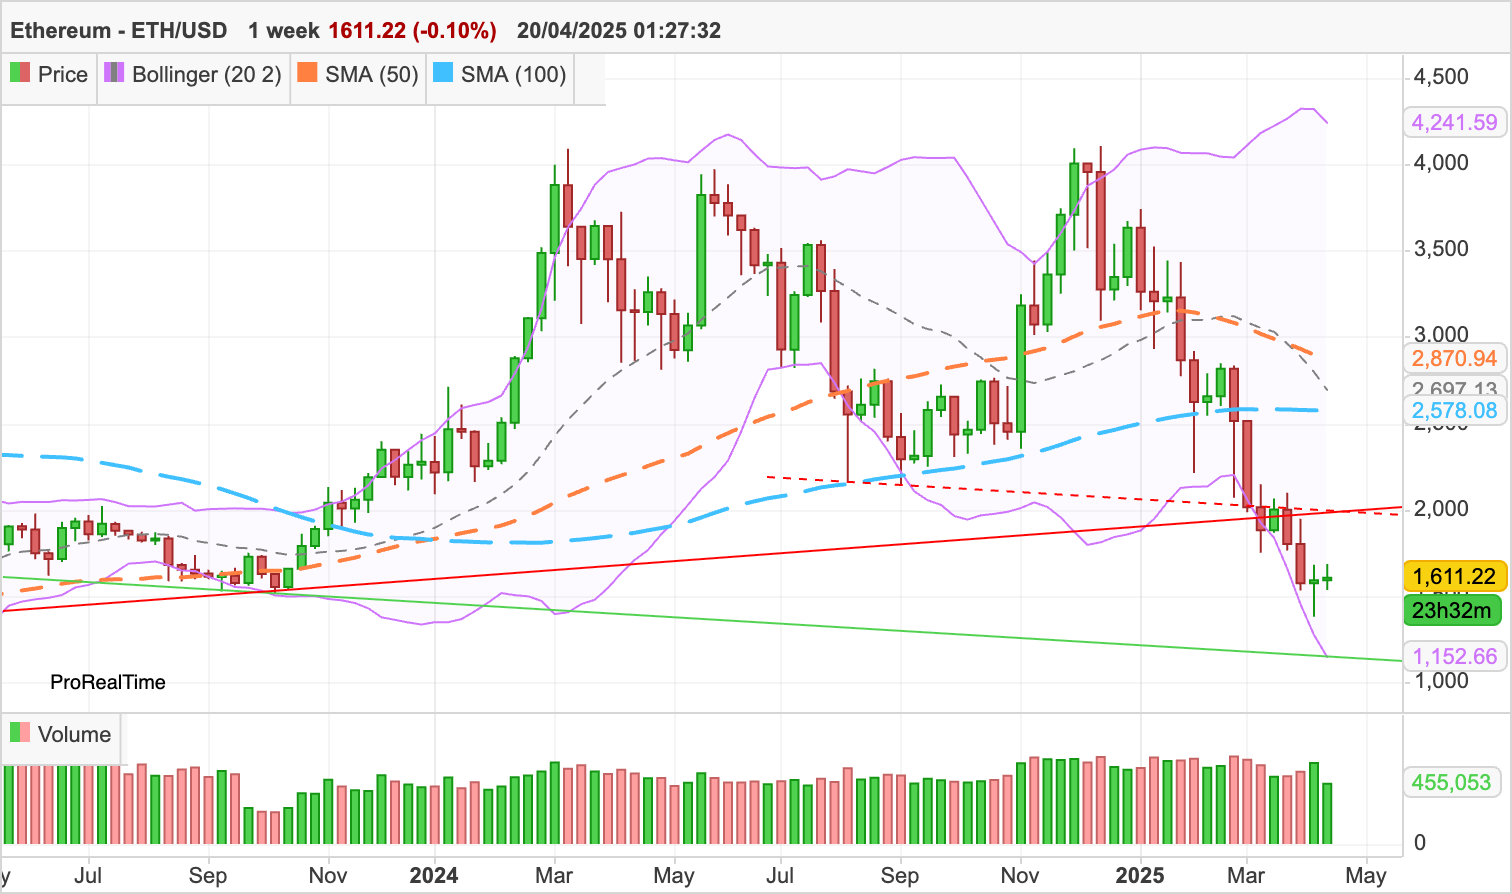
The Bollinger Bands on the weekly timeframe are tightening, with the lower band now around $1,153. If current levels break, this could act as a final support zone.
Meanwhile, the 50-week Simple Moving Average (SMA) is far above $2,871, and the 100-week SMA is at $2,578, levels that have now flipped from support to resistance. ETH also faces resistance from an oblique descending trendline near $1,998, which will likely cap any near-term upside.
The most concerning aspect for bulls is that ETH remains below the Bollinger average of $2,697, suggesting that the broader trend remains bearish. Volume has remained muted throughout the consolidation phase, implying buyers’ hesitation despite the perceived discount.
READ MORE: Trump Meme Coin Pumps After 40M Unlock: Is $TRUMP Breaking Out?