Cardano (ADA) is once again at a crossroads. The Layer-1 blockchain, known for its academic approach and gradual roadmap, is currently valued at $0.6219 at press time, just a 1.95% daily gain yet lacks significant bullish momentum.
Cardano, boasting a market cap of $21.94 billion and a 24-hour trading volume of $611.77 million, stays among the top 10 cryptocurrencies. However, the charts and analyst commentary show that the next move could be either a breakout toward $0.67 or a rejection that pushes ADA below $0.60 support.
Cardano Price Stuck Below $0.67 Resistance
According to crypto analyst AMCrypto, Cardano’s price is holding its short-term support trendline, but a reversal depends on confirmation of a breakout. He explained that ADA needs a 4-hour period close to $0.67 to validate a bullish breakout.
In his tweet on April 16, he shared a chart highlighting a rising support line where ADA consistently tests and gets rejected at the $0.67 resistance.
This resistance has become a psychological barrier in recent weeks, as the price of ADA has failed to hold above this level on multiple occasions. The trendline in his chart suggests Cardano is forming higher lows, a sign of underlying strength, but the lack of momentum above $0.65 keeps bulls on edge.
AMCrypto also points out a broader macro factor weighing sentiment — the unresolved U.S. vs. China trade tensions. He believes the uncertainty may be limiting Cardano’s price breakout potential in the near term.
Rising Wedge or False Breakout?
Meanwhile, analyst Bit Bull offers a more cautious outlook. In his latest tweet, he shares a 4-hour ADA/USDT chart showing a rising wedge—a bearish pattern that often signals an impending breakdown.
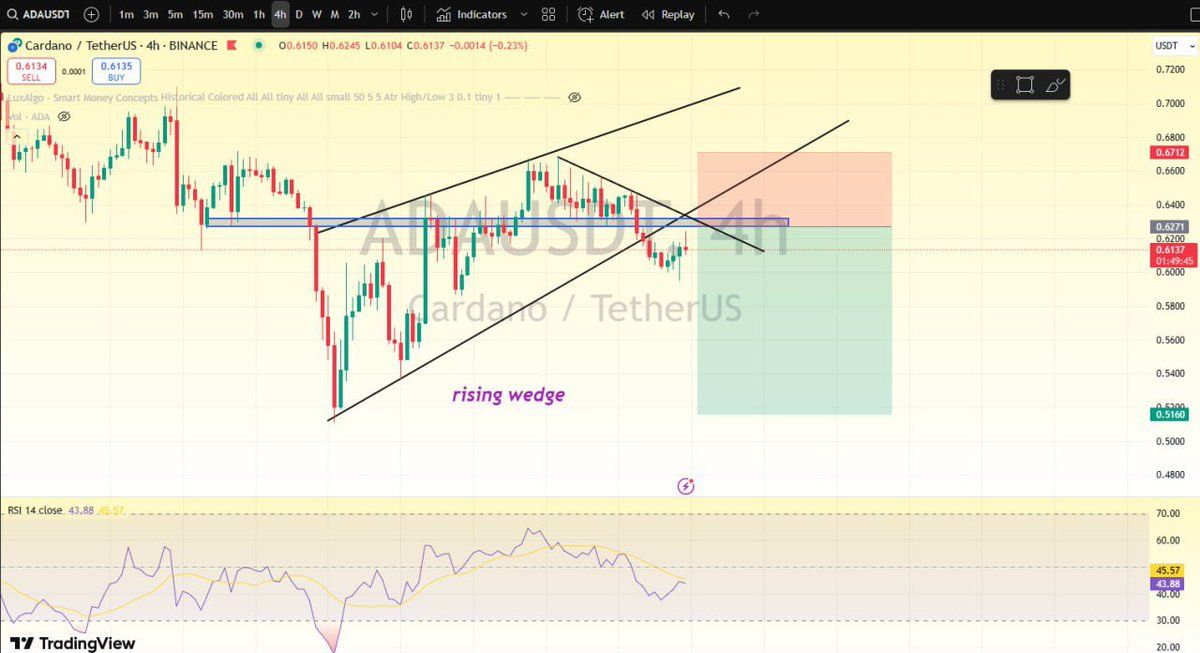
According to the cryptocurrency analyst, ADA might retest the wedge’s upper boundary before heading lower. He advises waiting for a better entry point and highlights the “next support zone” as the probable destination post-breakdown.
This rising wedge pattern has been forming since early April, and while it has offered decent trade setups for short-term traders, a breakdown from the wedge may result in a significant dip below $0.60, potentially retesting $0.55 or even $0.52, zones with substantial historical support.
ADA Shows Mixed Signals on the Daily Chart
A more zoomed-out perspective offers additional context. The daily candlestick chart on Central Charts, analyzed with Bollinger Bands and Simple Moving Averages (SMA), shows ADA trading just under the Bollinger average of $0.6315.
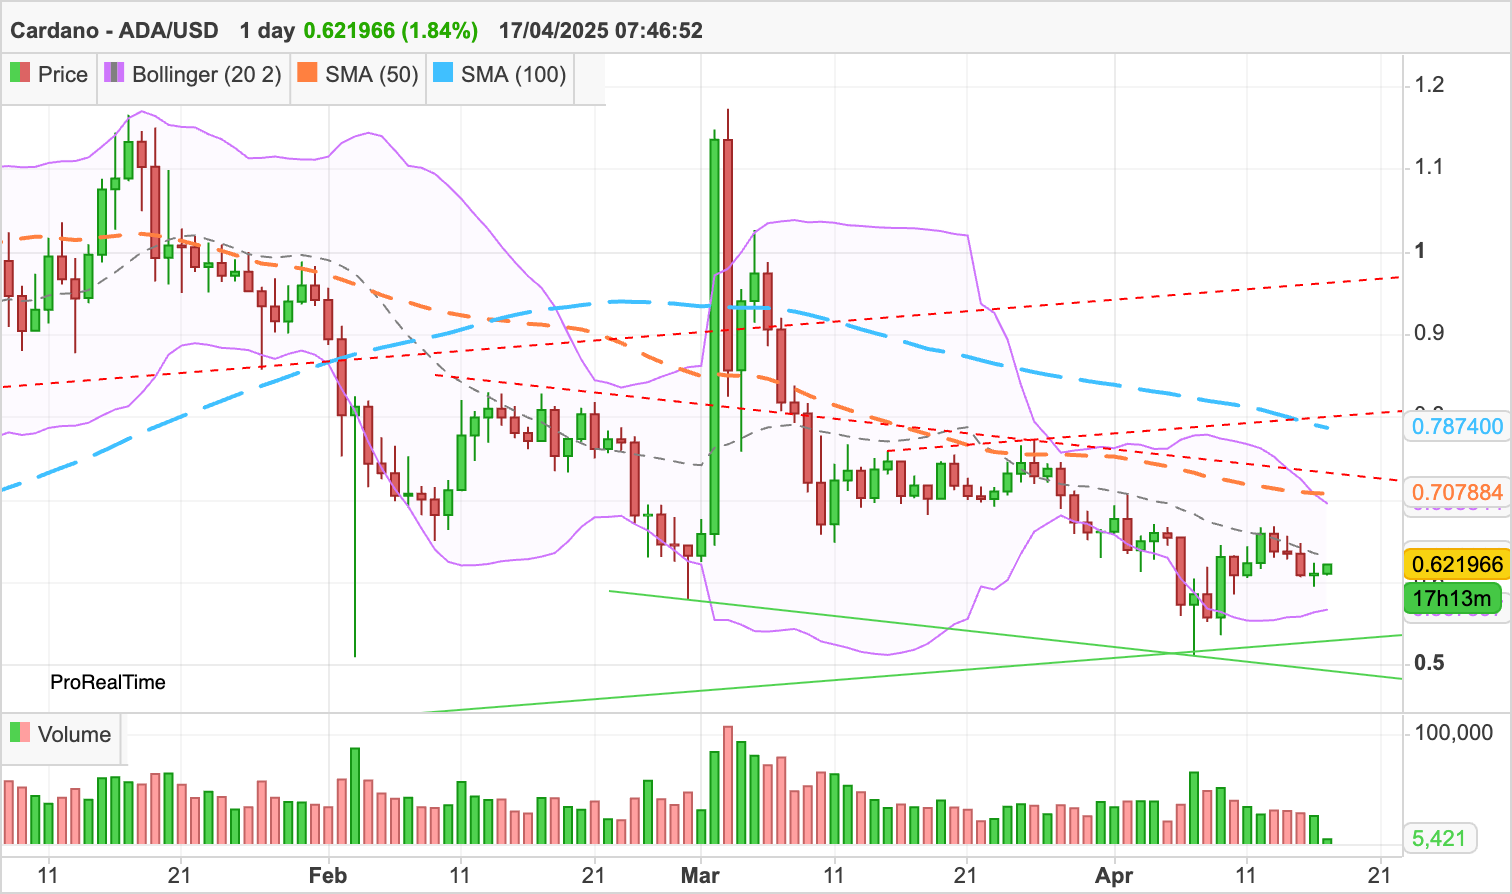
The Bollinger Bands are narrowing, indicating lower volatility — often a precursor to a sharp move. If ADA breaks above the upper Bollinger Band at $0.6958, it might rapidly climb above $0.70. Conversely, losing lower band support at approximately $0.56 risks bearish territory glides.
The SMAs offer further insight. The 50-day SMA is $0.70, while the 100-day SMA is $0.78. These moving averages act as overhead resistance zones and could limit upward momentum unless ADA prints several strong daily closes above current levels. Recently, volume has been relatively flat, suggesting neither bulls nor bears have taken complete control.
READ MORE: Polkadot Shows Buy Signal as Analysts Hint at a Rebound