


The SPDR S&P 500 (SPY) ETF may be at risk of a strong bearish breakdown ahead of the upcoming NVIDIA earnings and Donald Trump’s tariffs. SPY has formed numerous bearish chart patterns, indicating a strong sell-off in the coming days. So, will the S&P 500 index crash lead to a lower Bitcoin price?
SPY ETF Technicals Point to a Crash
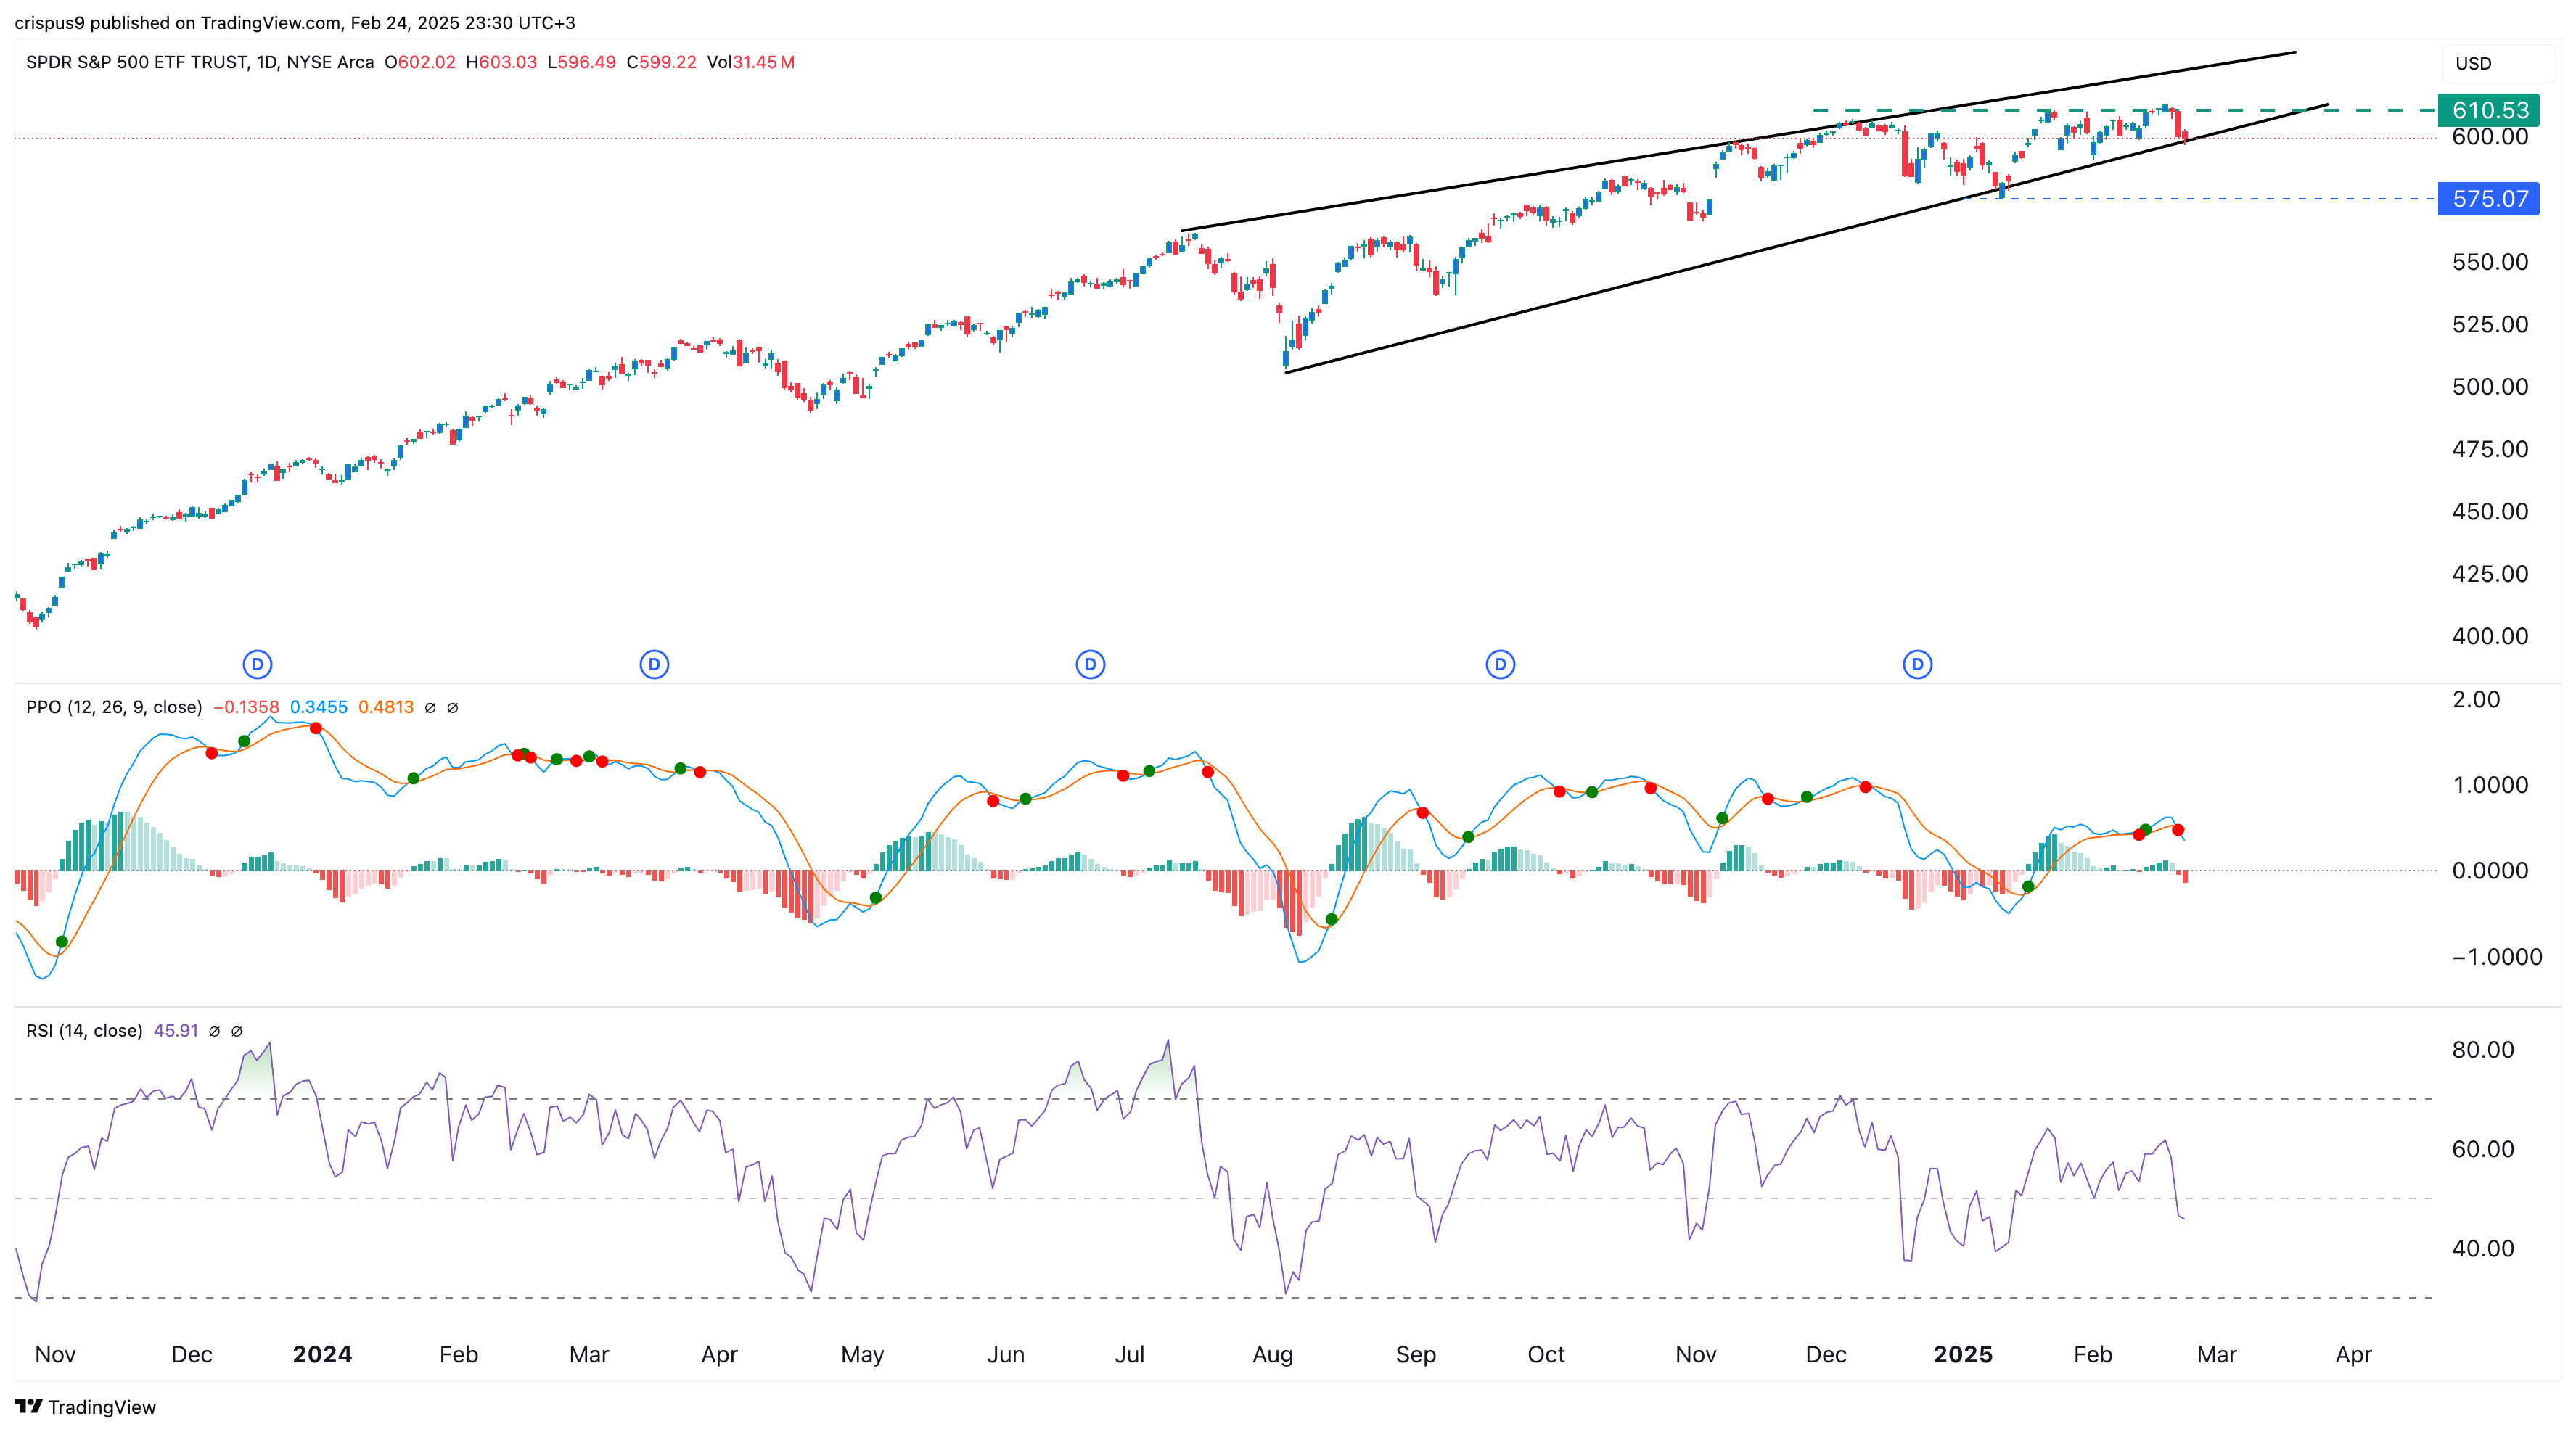
The daily chart shows the S&P 500 index is at significant risk of a bearish breakdown. First, it has formed a rising wedge chart pattern comprising two ascending and converging trendlines. These two lines are nearing their confluence, pointing to a bearish breakdown.
Second, it has formed a triple-top pattern at $610, with its neckline at $575. Like the wedge, the triple-top is one of the most bearish patterns in technical analysis.
Further, the two lines of the Percentage Price Oscillator (PPO) have formed a bearish crossover, while the Relative Strength Index (RSI) has dropped below the neutral line. Therefore, there is a possibility that the blue-chip SPY ETF will have a strong bearish breakdown, with the initial target being $575, down by 4% from its current level.
NVIDIA earnings and Donald Trump’s tariffs are potential catalysts for the S&P 500 index crash. Weak NVIDIA earnings, coupled with DeepSeek AI concerns, would push its stock lower and then drag the index in the same direction.
The US is expected to unveil a series of tariffs next week. It will add a 25% tariff on steel and aluminum and imported goods from Canada and Mexico. These tariffs will impact S&P 500 stocks and affect their earnings, leading to a crash.
READ MORE: 2 Risks May Crash Bitcoin, Cardano, Polkadot, Pepe, and Altcoin Prices
Technicals Hint at a Potential Bitcoin Price Crash
A strong S&P 500 index crash may negatively impact the Bitcoin price since some correlation still exists between the two assets.
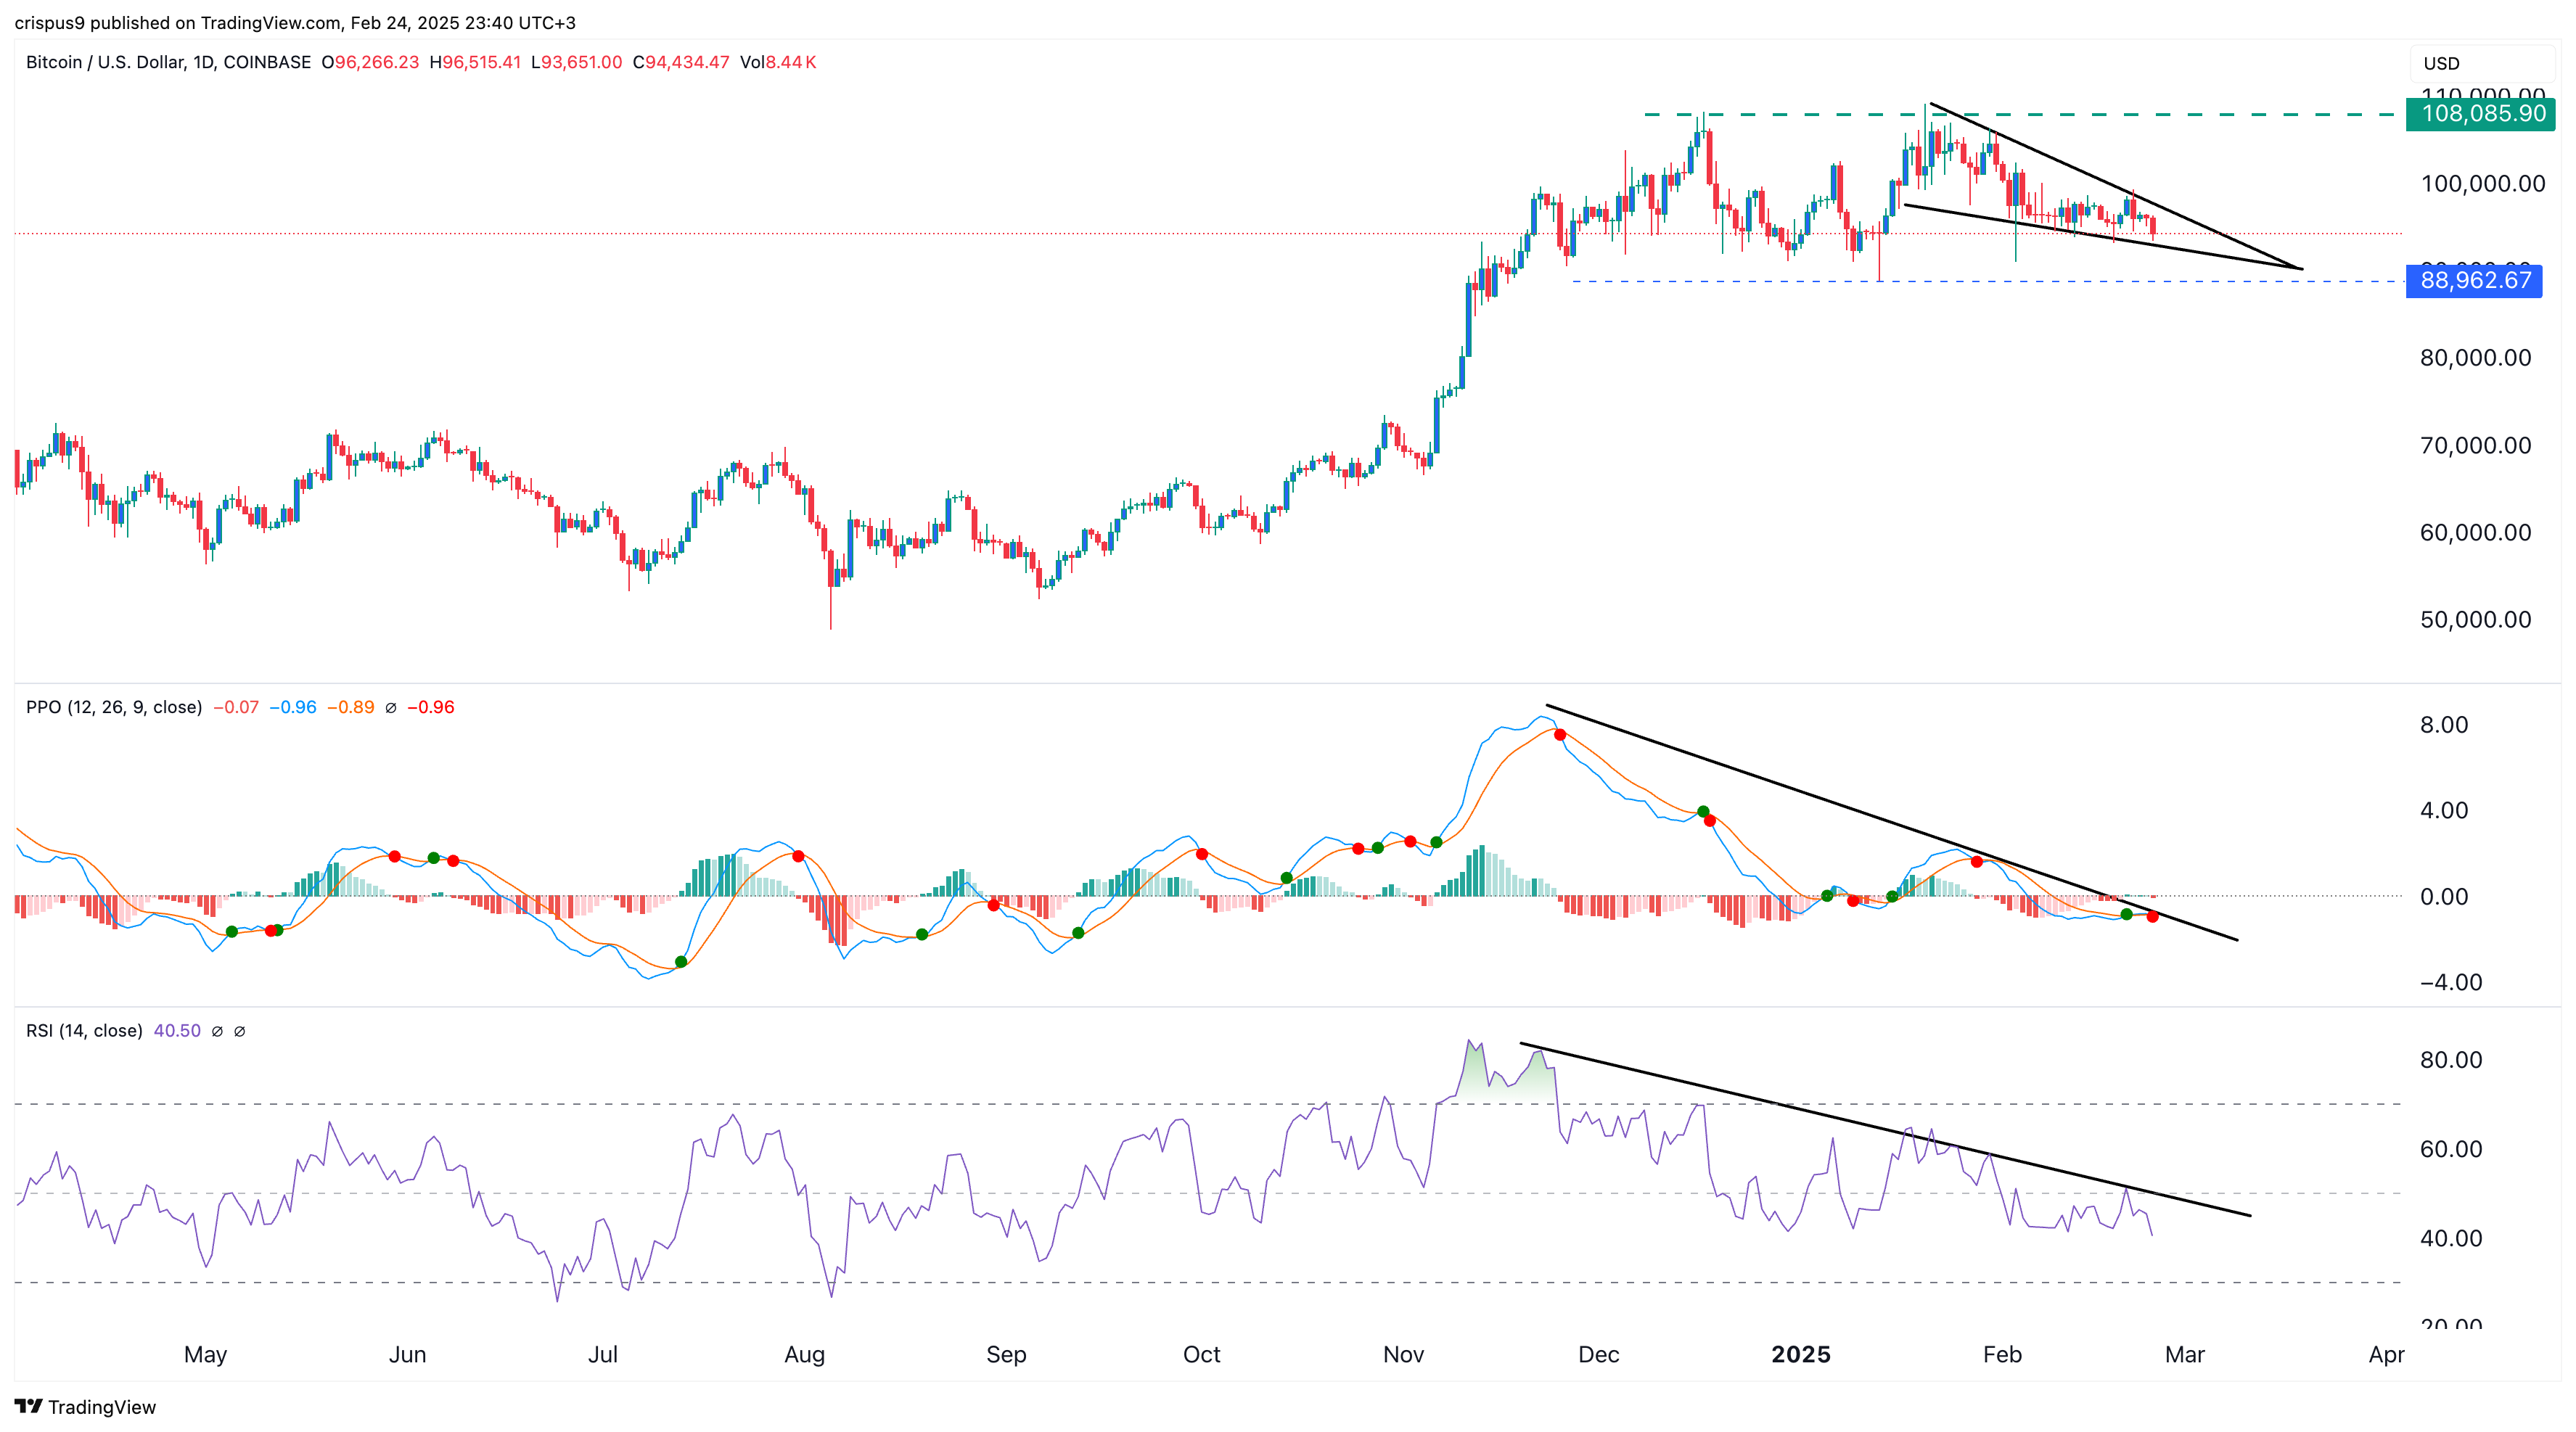
Bitcoin has formed a double-top pattern at $108,085, with its neckline around the $90,000 level. A DT pattern often leads to a strong bearish breakdown. Bitcoin has crashed below the 50-day moving average, a sign that bears are prevailing.
Additionally, the Relative Strength Index (RSI) and the Percentage Price Oscillator (PPO) have continued falling, suggesting that the downtrend may continue. Such a drop would initially target the key support at $88,962, the lowest swing on January 13. A move below that point would increase the likelihood of the price dropping further, potentially reaching $80,000.
It is not all doom and gloom for the Bitcoin price ahead of NVIDIA earnings. It has formed a falling wedge pattern, which is a sign that a bullish breakout may also happen.
READ MORE: Chart of the Week: BNB Price Wavers Ahead of Pascal Hard Fork