

The crypto market this week was a roller coaster. Bitcoin’s $10,000 swing (from weekly highs of $104,000 to weekly lows of $92,000) caused a lot of volatility. Here, we want to perform a price analysis for three of the top cryptocurrencies and check their support/resistance levels.
Solana (SOLUSDT)
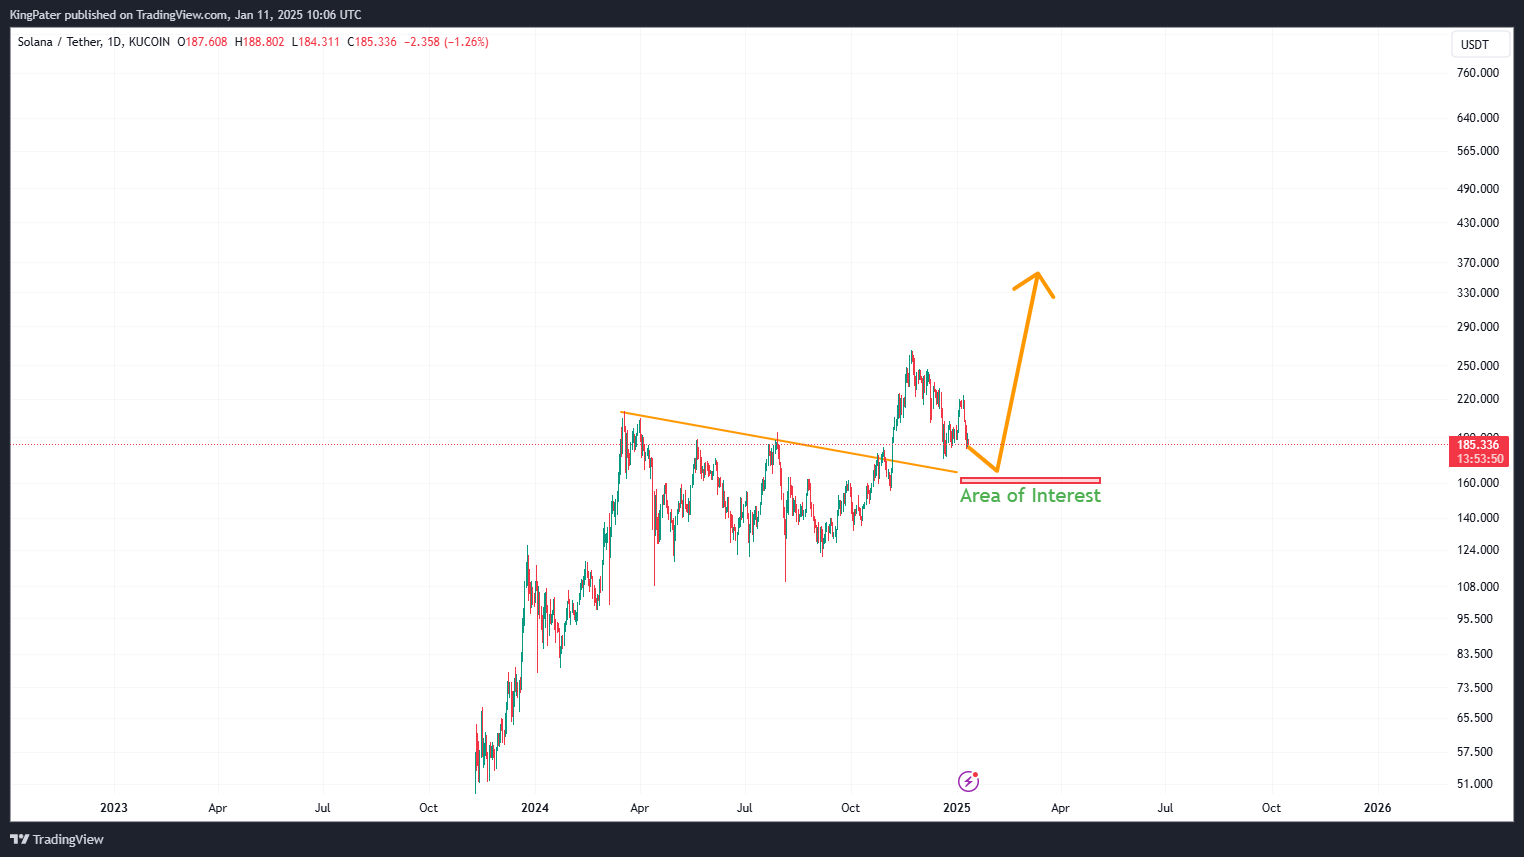
Solana’s price action shows an interesting interplay between bulls and bears. However, the real fight is bound to happen around the $160 trendline. At the time of writing, Solana is trading at $187.9 with a daily gain of 1.1%. The daily volume is $3.76 million, with little volatility in the last 24 hours.
SOL Price Analysis
Looking at the daily chart, Solana has been in sell mode since the Nov 24 high of $263, but buyers are taking respite in the fact that it is completing a retest from its recent breakout. The bulls will look to gain control around $160, and they might push towards the $350 Price.
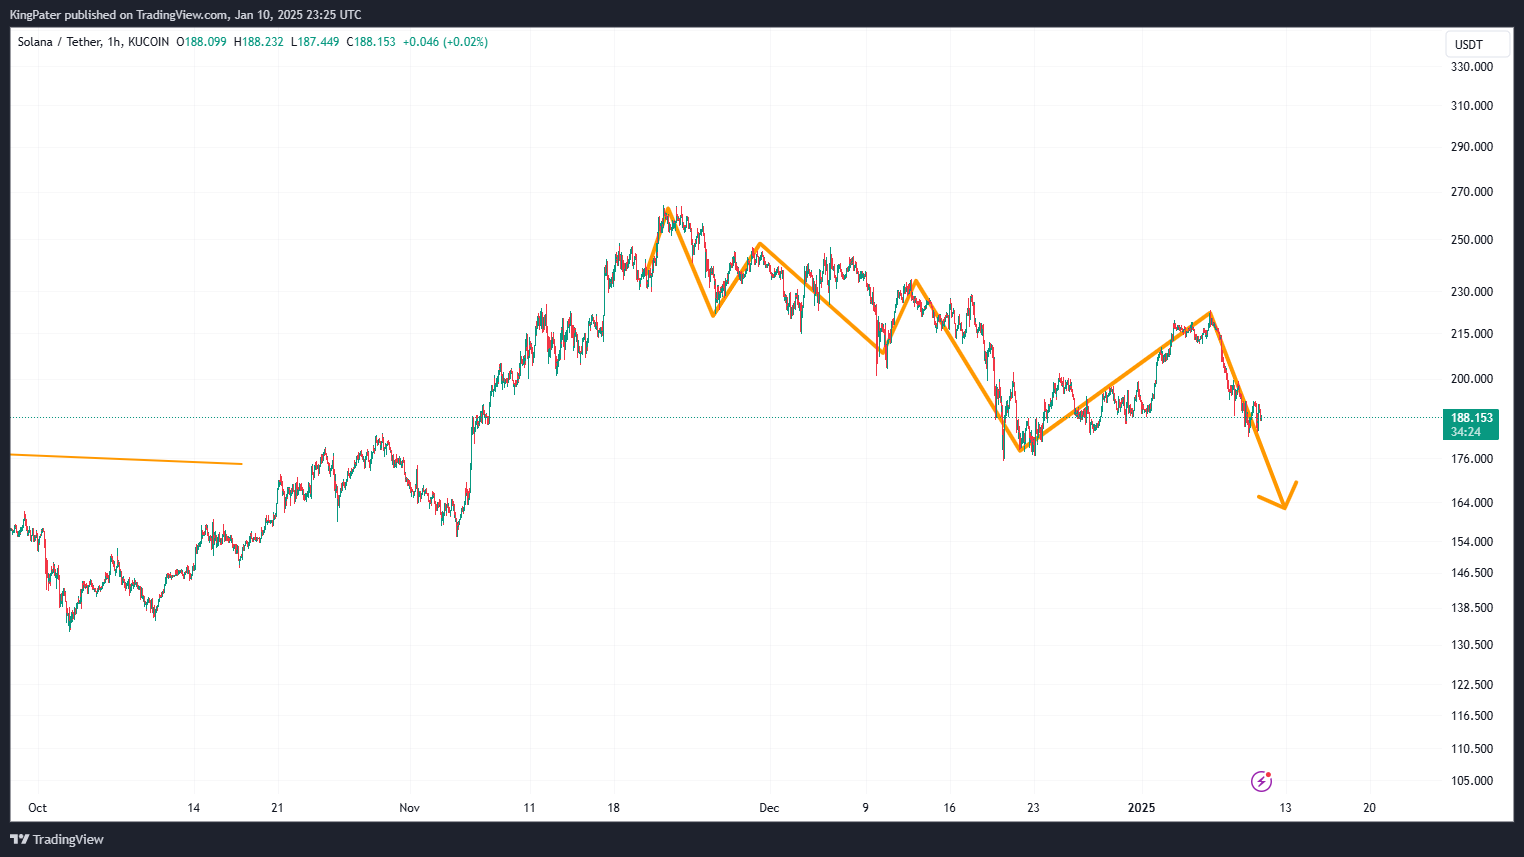
Zooming into the Hourly time frame, Solana has been forming a series of lower highs and lower lows, presumably poised for a reversal at the $157 support. If this support level fails, the daily support of $127 would be the bulls’ next fight.
Ethereum (ETHUSDT)
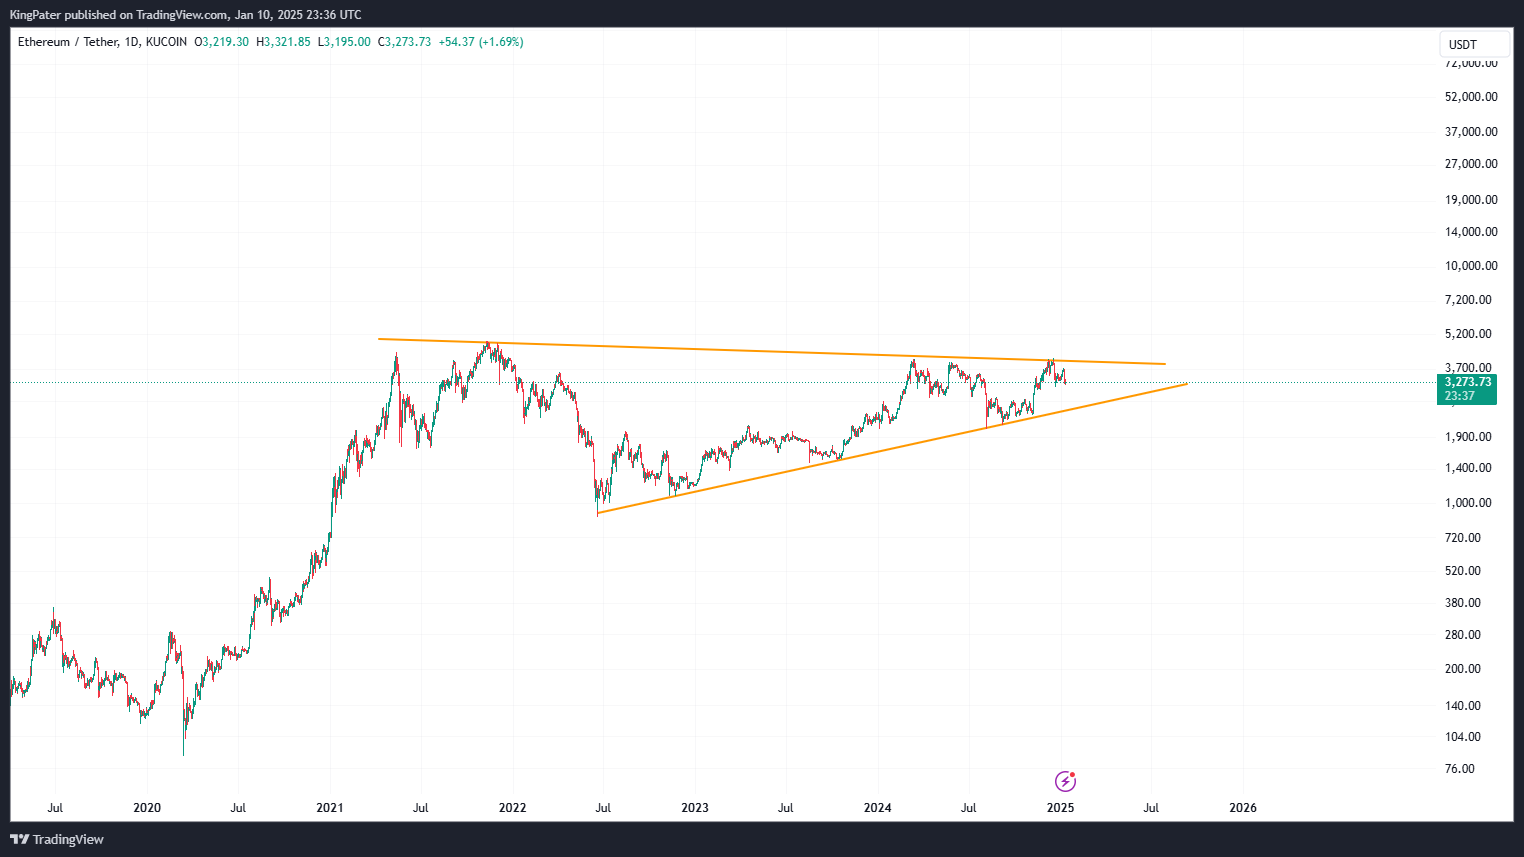
Ethereum faithfuls have had one request since March 2024: a break above $4,000. With Ethereum’s current price chart, Bulls might need to wait a bit longer. Ethereum’s price is $3,273, a 10% drop from last week.
ETH Price Analysis
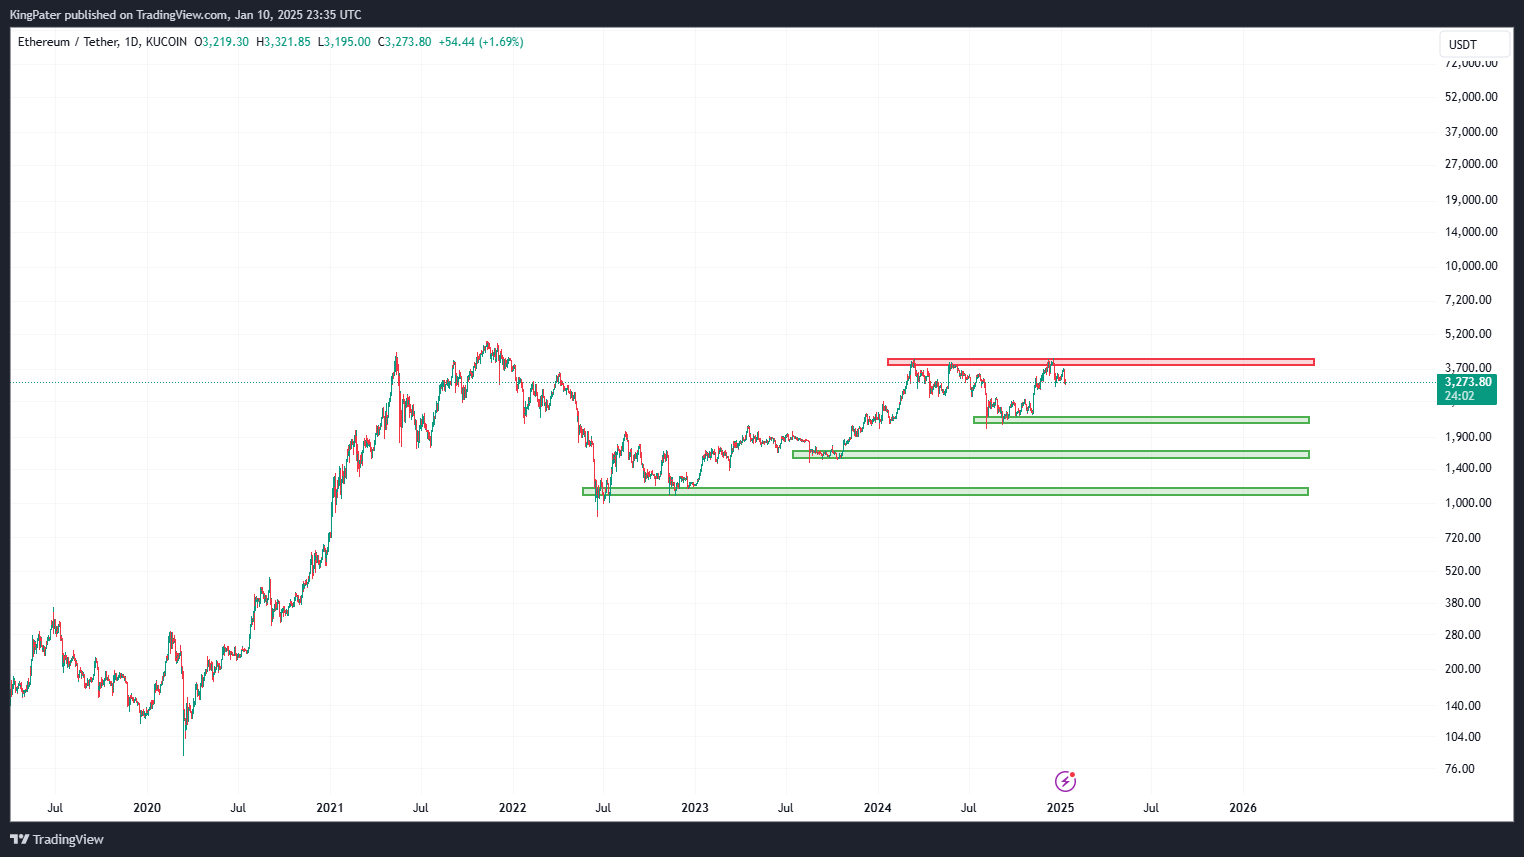
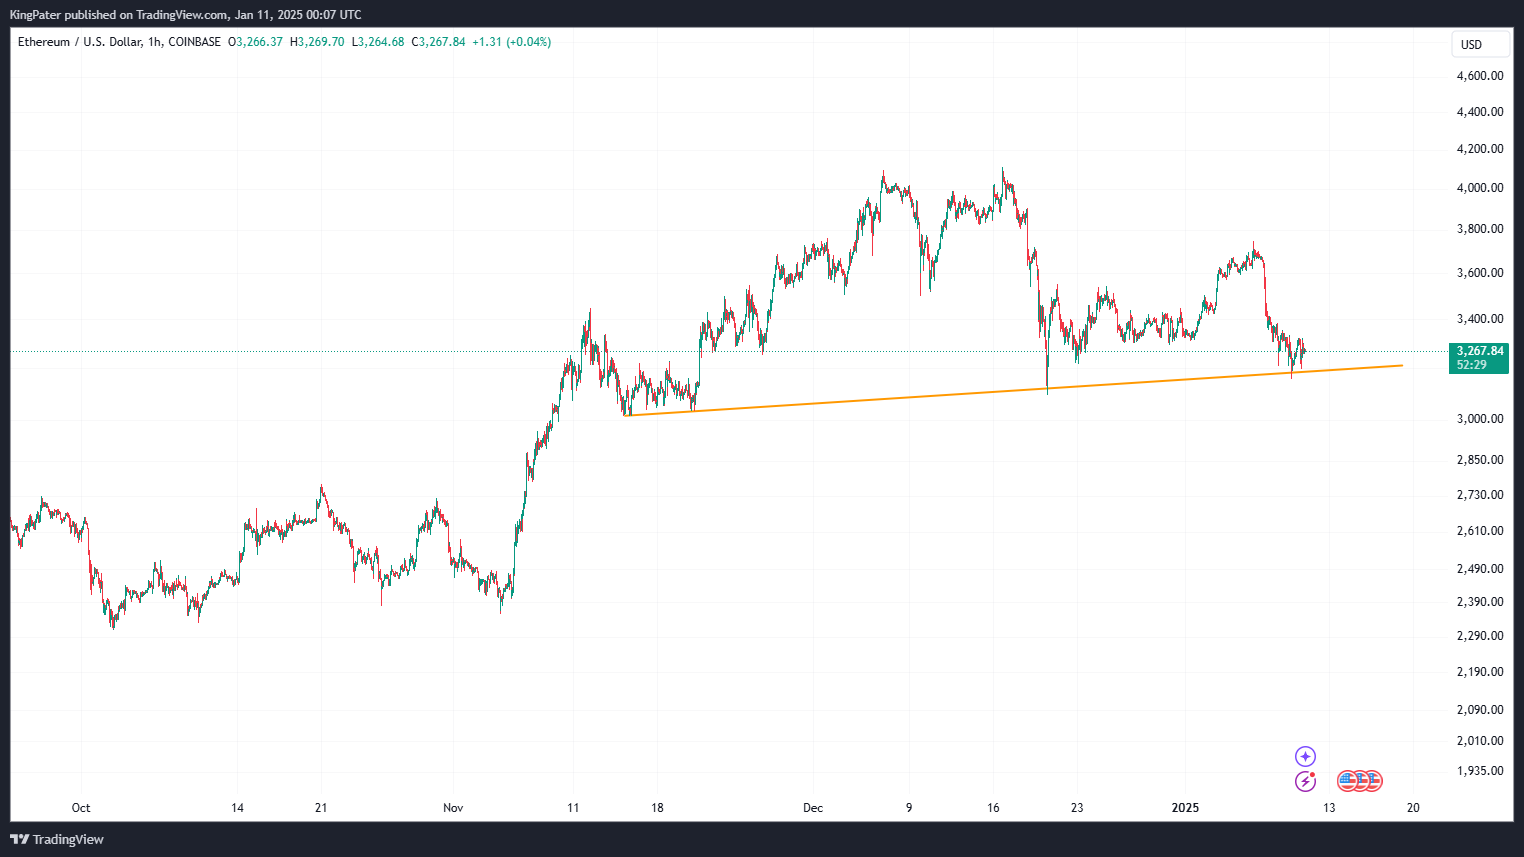
On the daily chart, Ethereum’s price is currently constricted. The resistance of $4000 has held firm, but we are seeing higher lows.
Savvy traders would easily notice an inverted Head and Shoulder pattern forming on the 4H timeframe. A convincing break of $4,000 might see Ethereum breeze past its all-time high and target 6,000.
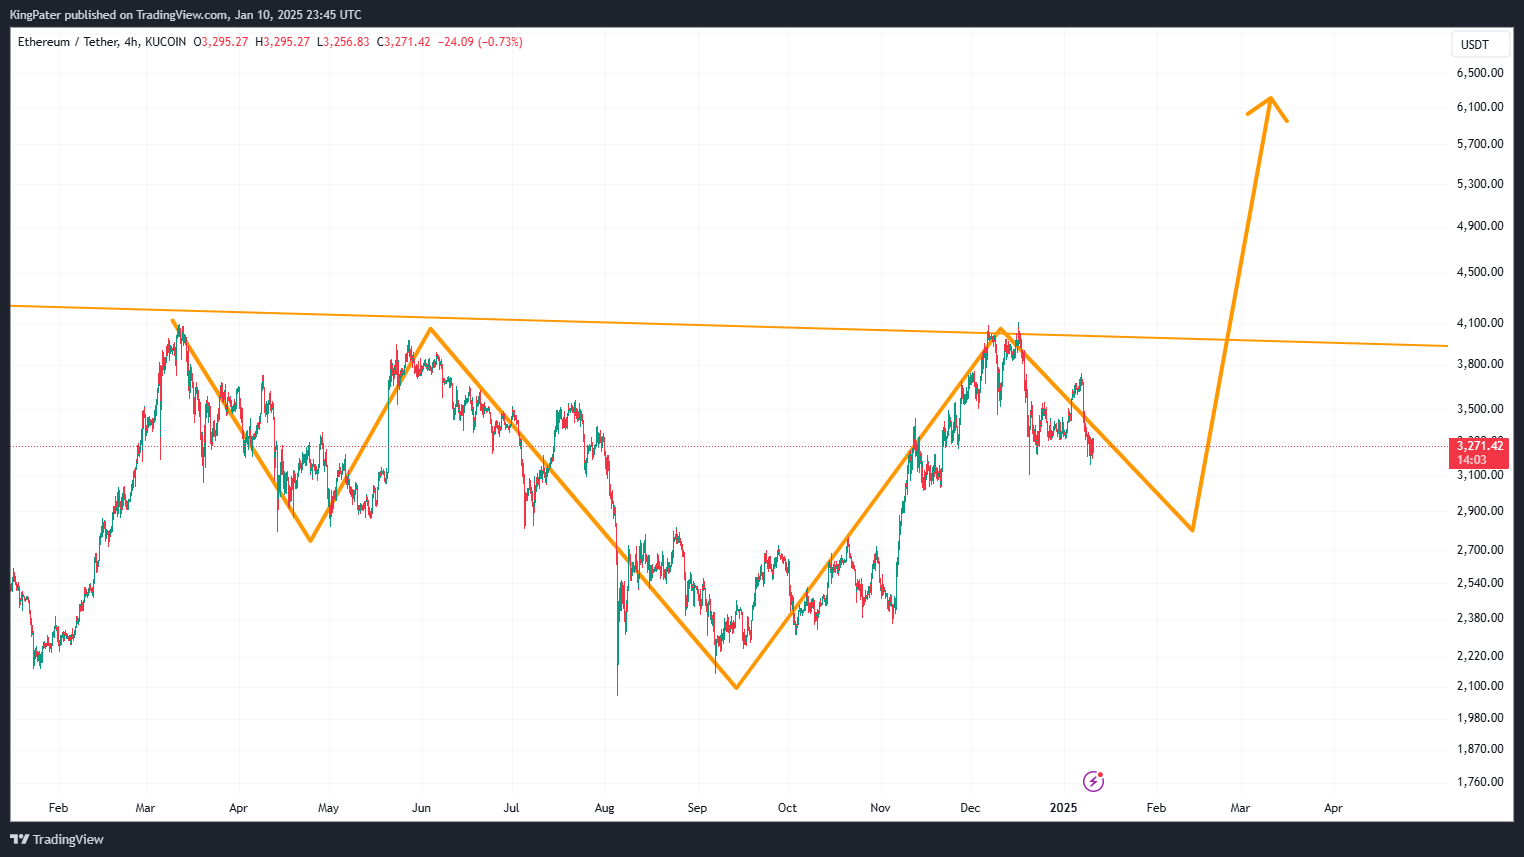
On lower time frames, we can see a head-and-shoulder pattern forming, although the slanting neckline might suggest that the pattern is less reliable.
TONCOIN (TONUSDT)
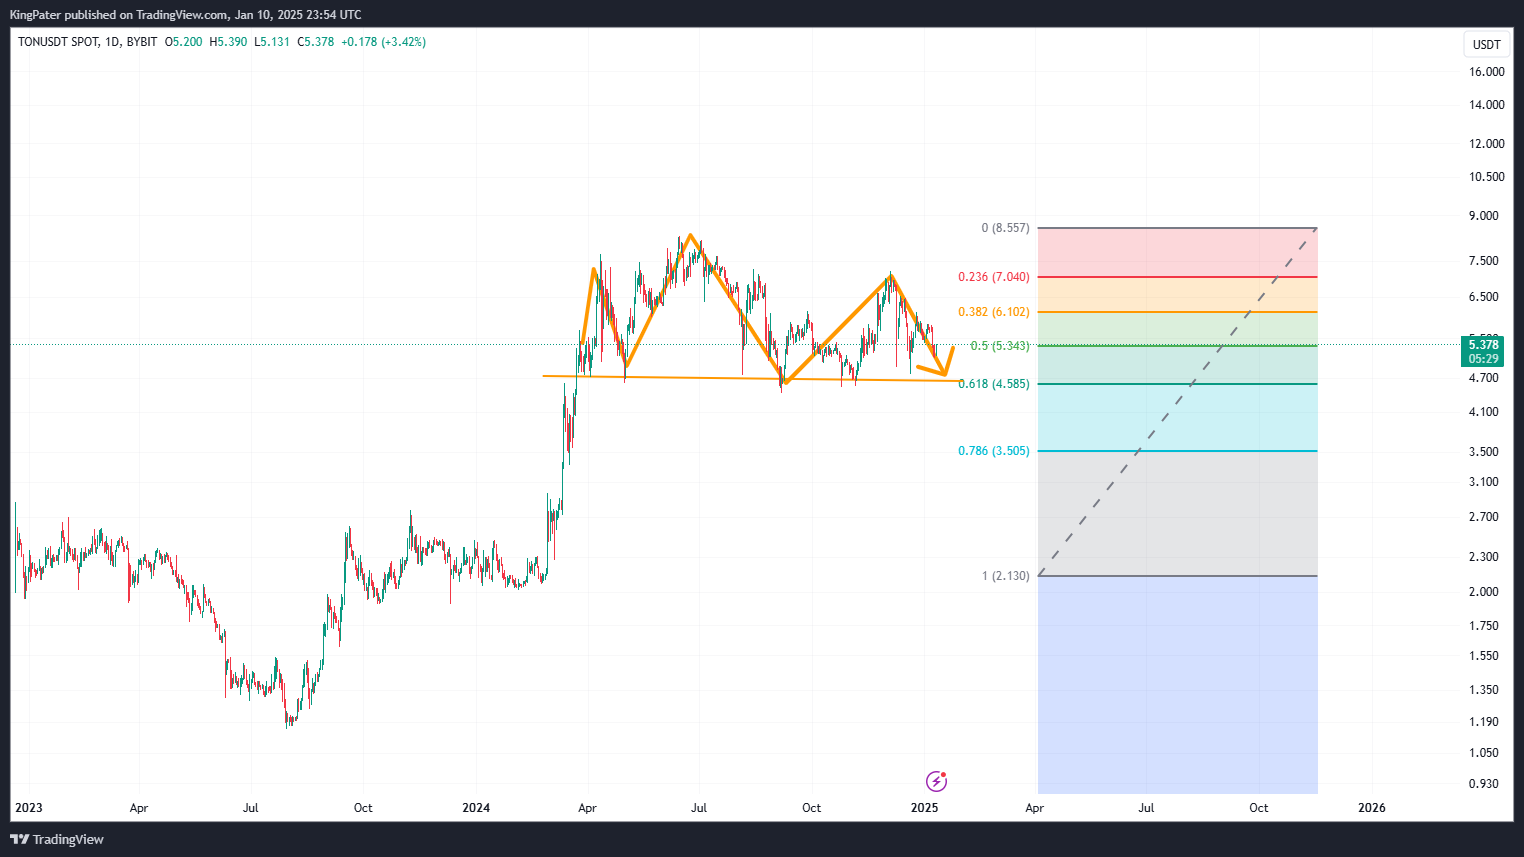
Ton has been experiencing a slow grind towards its $4.6 support. Buyers have defended the support zone thrice and will need to do it one more time. Ton’s current price is $5.38. with a daily volume of $198 million, 8% less than the previous day.
TON Price Analysis
On the daily chart, Ton has a clear head and shoulder pattern formed. Although bulls are still very much in this market, a break of the $4.690 support might see Ton slide down to the $2.7 zone. Coincidentally, the $4.6 support also falls on the 61.8% Fib level, and bulls will fight to defend it.
READ MORE: AIXBT and COOKIE AI Tokens See Double-Digit Gains: What Happened?