


Solana prices have been pointing towards a bearish move after tumbling over 2.3% for the day and being one of the worst performers. However, some market participants still have high hopes for the coin’s future trajectory.
Solana weekly move shows volatile trading
The price of Solana had extremely erratic fluctuations this past week, impacted by both technical and fundamental considerations. SOL was recuperating from the severe decline during the August 5th market crisis, during which it fell by more than 11% in a single day. The week began negatively for the company.
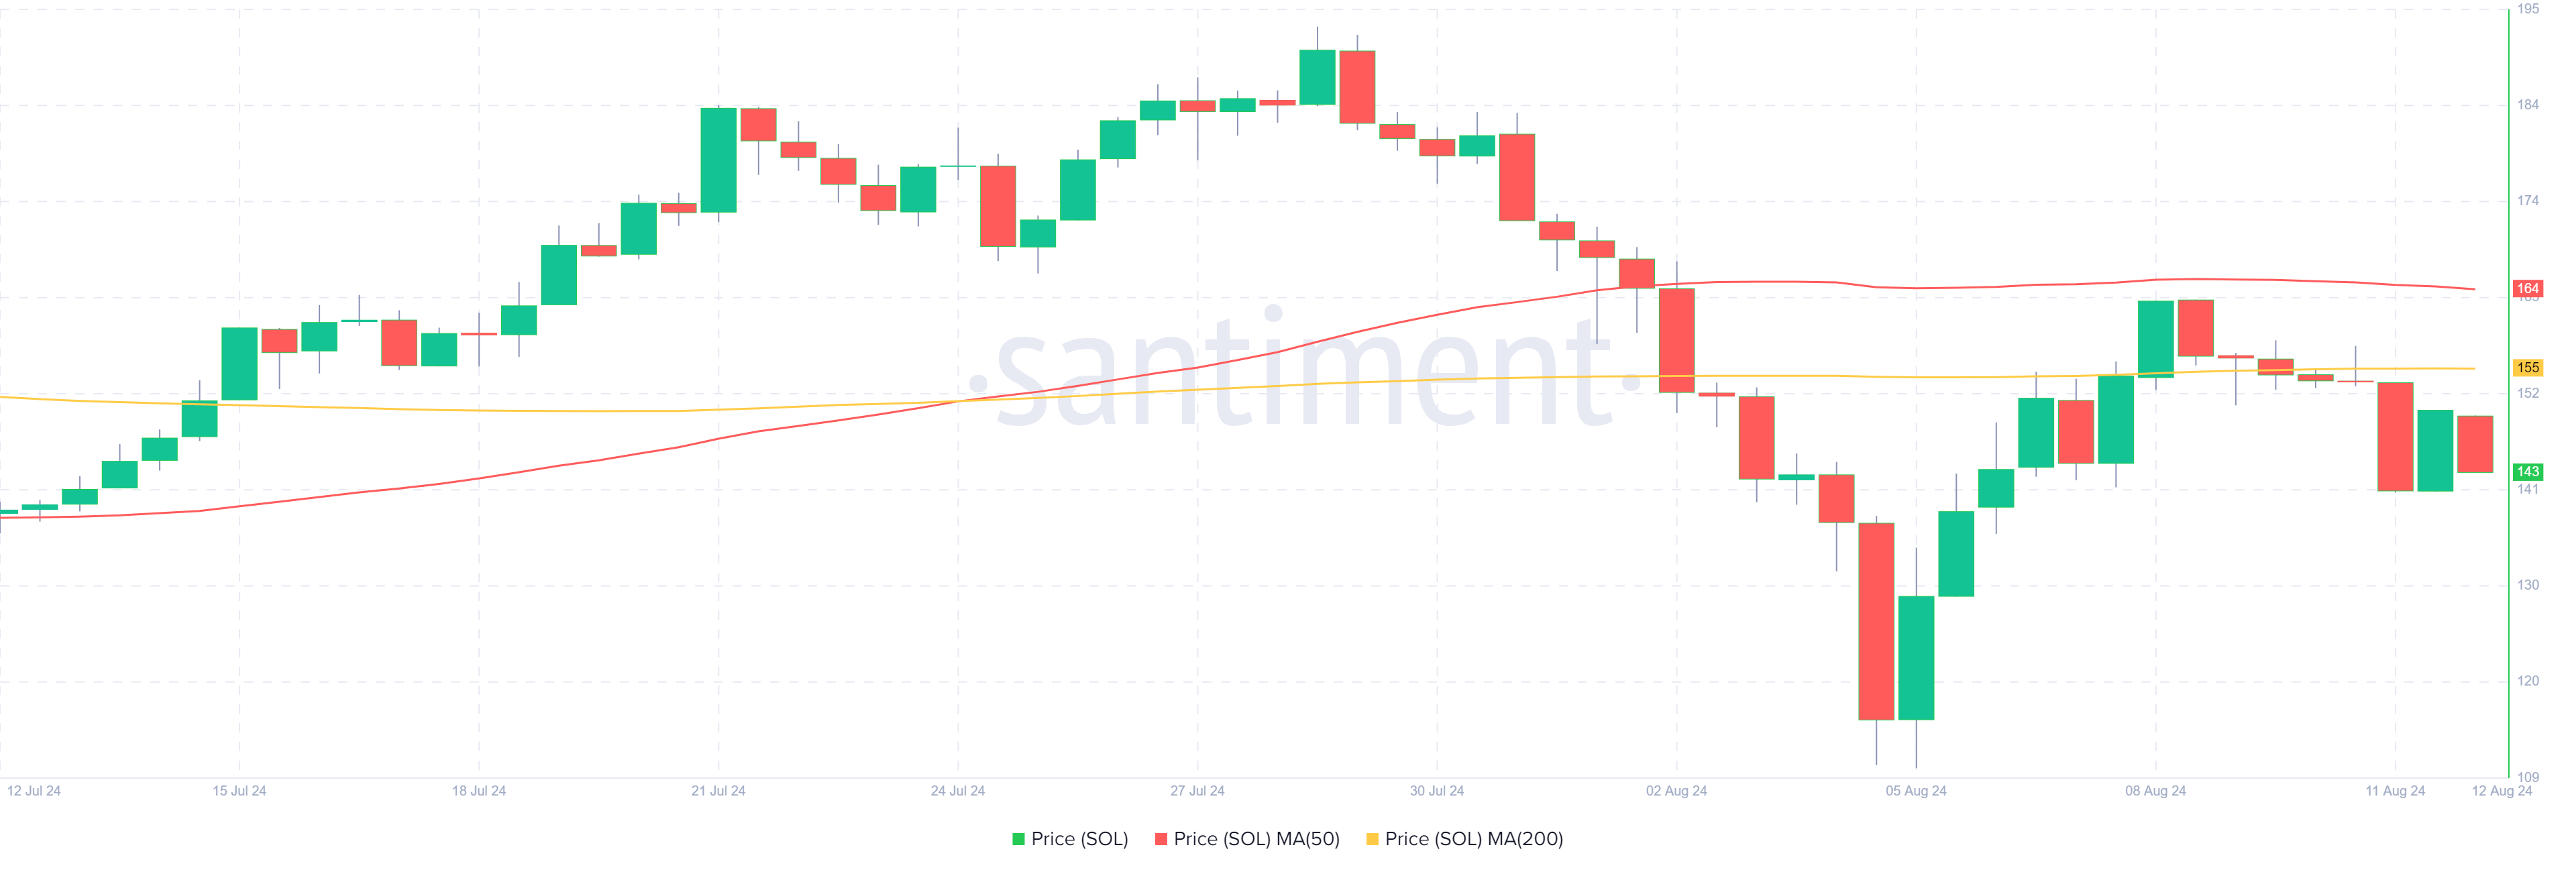
But by the middle of the week, the tide started to change as bullish momentum increased, propelled by positive news from Brazil. The announcement on August 8th that Brazil had authorized a Solana ETF caused SOL’s price to rise sharply.
The news created a solid support base above the $150 mark and propelled a 12% rise. Initial optimism was further bolstered by rumors that VanEck’s Solana spot ETF application in the US could also be approved.
Solana on-chain metrics hits a bearish turn
If worries about a market correction persist, SOL price might drop 16.5% to $126 as it tests the support of the triangle formation following a breach below $150. A decline in important on-chain indicators supports a pessimistic outlook for Solana pricing projections.
The number of new addresses interacting with the network dropped from 1.27 million on August 1st to 980.68k, indicating a 22.79% fall.
Despite the adverse mood shown by the volume surrounding Solana, market experts still believe Solana can rise again in the coming days. Historical data indicates SOL has made notable gains in previous bull runs, with price increases from its critical support levels.
I honestly think that $SOL is going to hit $1,000 this cycle. pic.twitter.com/vb3i3VbiT4
— Crypto Rover (@rovercrc) August 9, 2024
As an indicator of the rate of price fluctuations, the Relative Strength Index (RSI) is currently at 43.15, which is quite neutral and indicates that the market is not yet overbought or oversold. This implies that there may be some wiggle room for the price to vary without direct pressure from forces that drive oversell or overbuying.
On the other hand, there is a bearish crossover in the Moving Average Convergence Divergence (MACD), a technical indicator of changes in the strength, direction, momentum, and length of a trend in the price of a cryptocurrency.
The MACD line, a common marker of possible negative momentum, has crossed below the signal line, indicating a possible waning of the optimistic attitude if the momentum continues.


