


- The Nasdaq 100 index has formed a risky double-top pattern.
- There are significant risks to the American economy, including high inflation.
- The Federal Reserve has pointed to another rate hike soon.
A sense of fear has returned to the market in the past few weeks. As a result, the fear and greed index has dropped to the fear area of 36 while stocks, cryptocurrencies, and bonds have retreated. The tech-heavy Nasdaq 100 index has dropped to the key support at $14,600 while Bitcoin price has been stuck at ~$26,000. Other coins like EOS, IOTA, and Ethereum have also retreated.
Nasdaq 100 index risks
The Nasdaq 100 and S&P 500 indices are the two most popular chart patterns in the market. The two indices track the biggest companies in the world like Apple, Amazon, Google, and Microsoft.
American stocks have gone through major headwinds in the past few months. For example, the Nasdaq 100 index has dropped by more than 7.6% and is nearing the correction zone of 10%.
This decline has happened because of several important factors. First, the Federal Reserve has hinted that it will deliver another rate hike this year. If this happens, it will push them to between 5.50% and 5.75%, the highest point in over two decades.
Historically, risky assets like technology stocks and cryptocurrencies underperform in a high-interest environment. For one, high rates make money market funds quite attractive to most investors.
Second, there are supply chain risks as drought pushes water at the Panama Canal much lower. As a result, it is taking longer for container ships to cross the important canal.
Third, the Nasdaq 100 index has crashed because of the ongoing slowdown in China. Recent data showed that key parts of the economy like real estate, retail sales, and industrial production are not doing well.
There are other risks to the economy. For example, UAW workers are still in a major strike that could go on for years while crude oil price has jumped.
Read more: How to buy Ethereum.
Nasdaq 100 index dangerous pattern
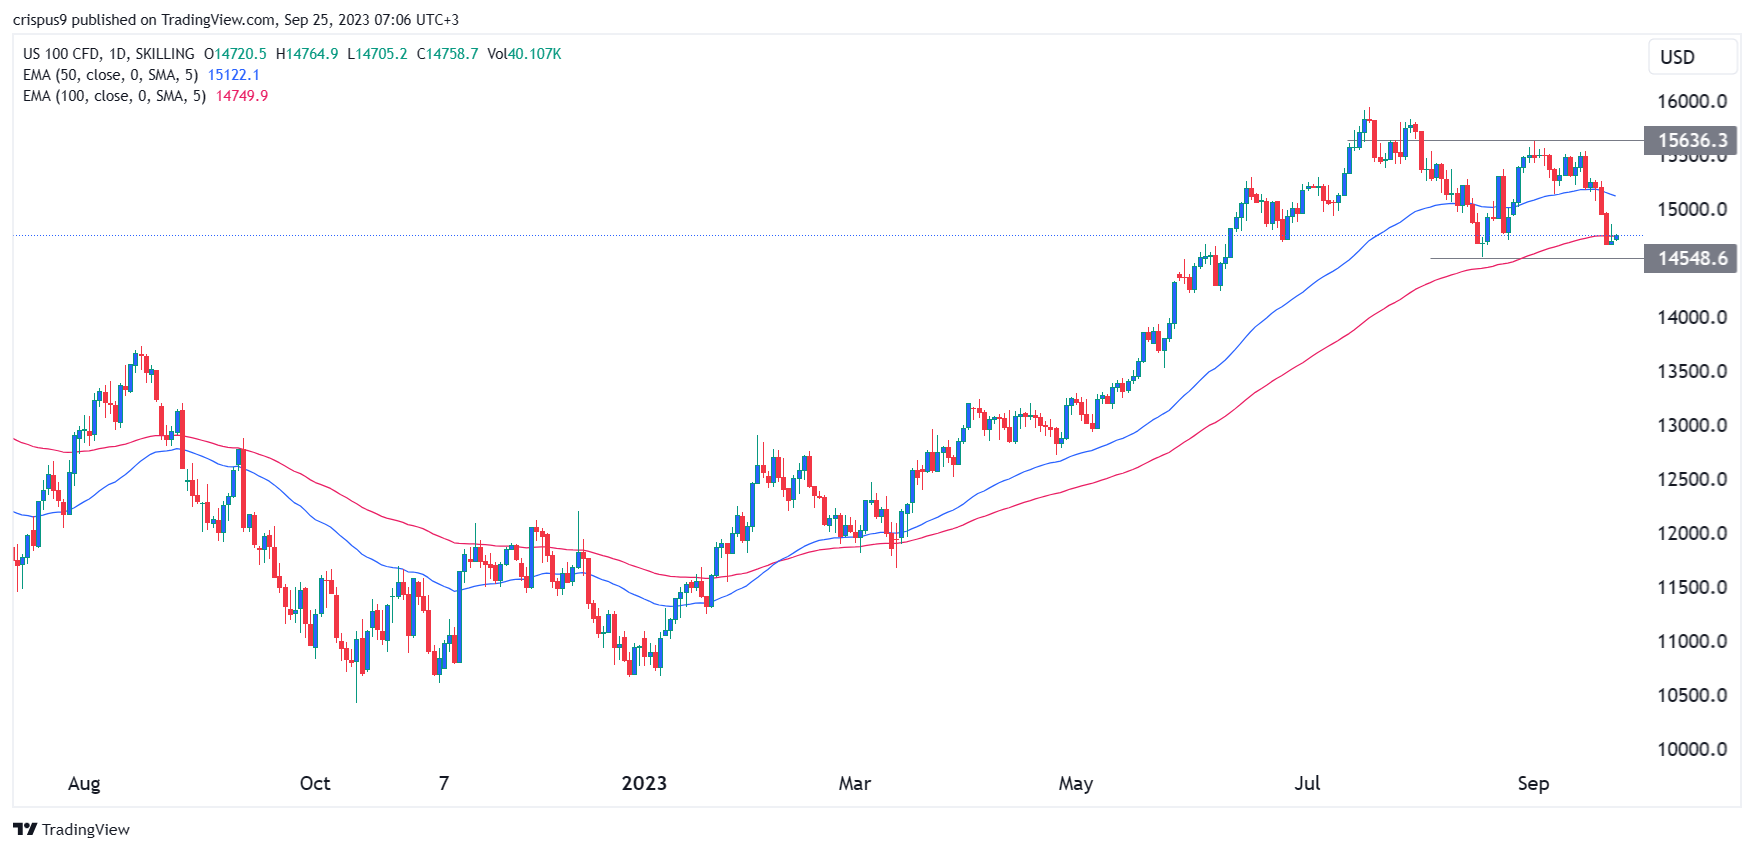
There are also technical concerns about the Nasdaq 100 index. As shown above, the index has formed what looks like a double-top pattern at $15,635. Its neckline was at $14,548. In price action analysis, this pattern is one of the most bearish ones in the world.
At the same time, the Nasdaq 100 index has crossed the important 50-day moving average, signaling that bears are gaining control. The index is now at the 100-day moving average and is slightly above the key support at $14,548. Therefore, there is a likelihood that the index will soon have a bearish breakout to $14,000.
The Nasdaq 100 index performance has implications for cryptocurrencies like Bitcoin, Ethereum, Cardano, EOS, IOTA, and Chainlink. Historically, like the Nasdaq 100 index, cryptocurrencies are seen as risky assets. Also, they have a correlation with American stocks. Therefore, more downside for the index will lead to a bearish breakout for these coins.


