


The Ethereum price slumped this year as the network faced substantial competition from top layer-1 and layer-2 blockchains and as ETF outflows intensified. The market has largely overlooked the impact of the Pectra upgrade. In this report, we will conduct a multi-timeframe analysis and identify potential ETH price targets.
ETH Price Weekly Analysis
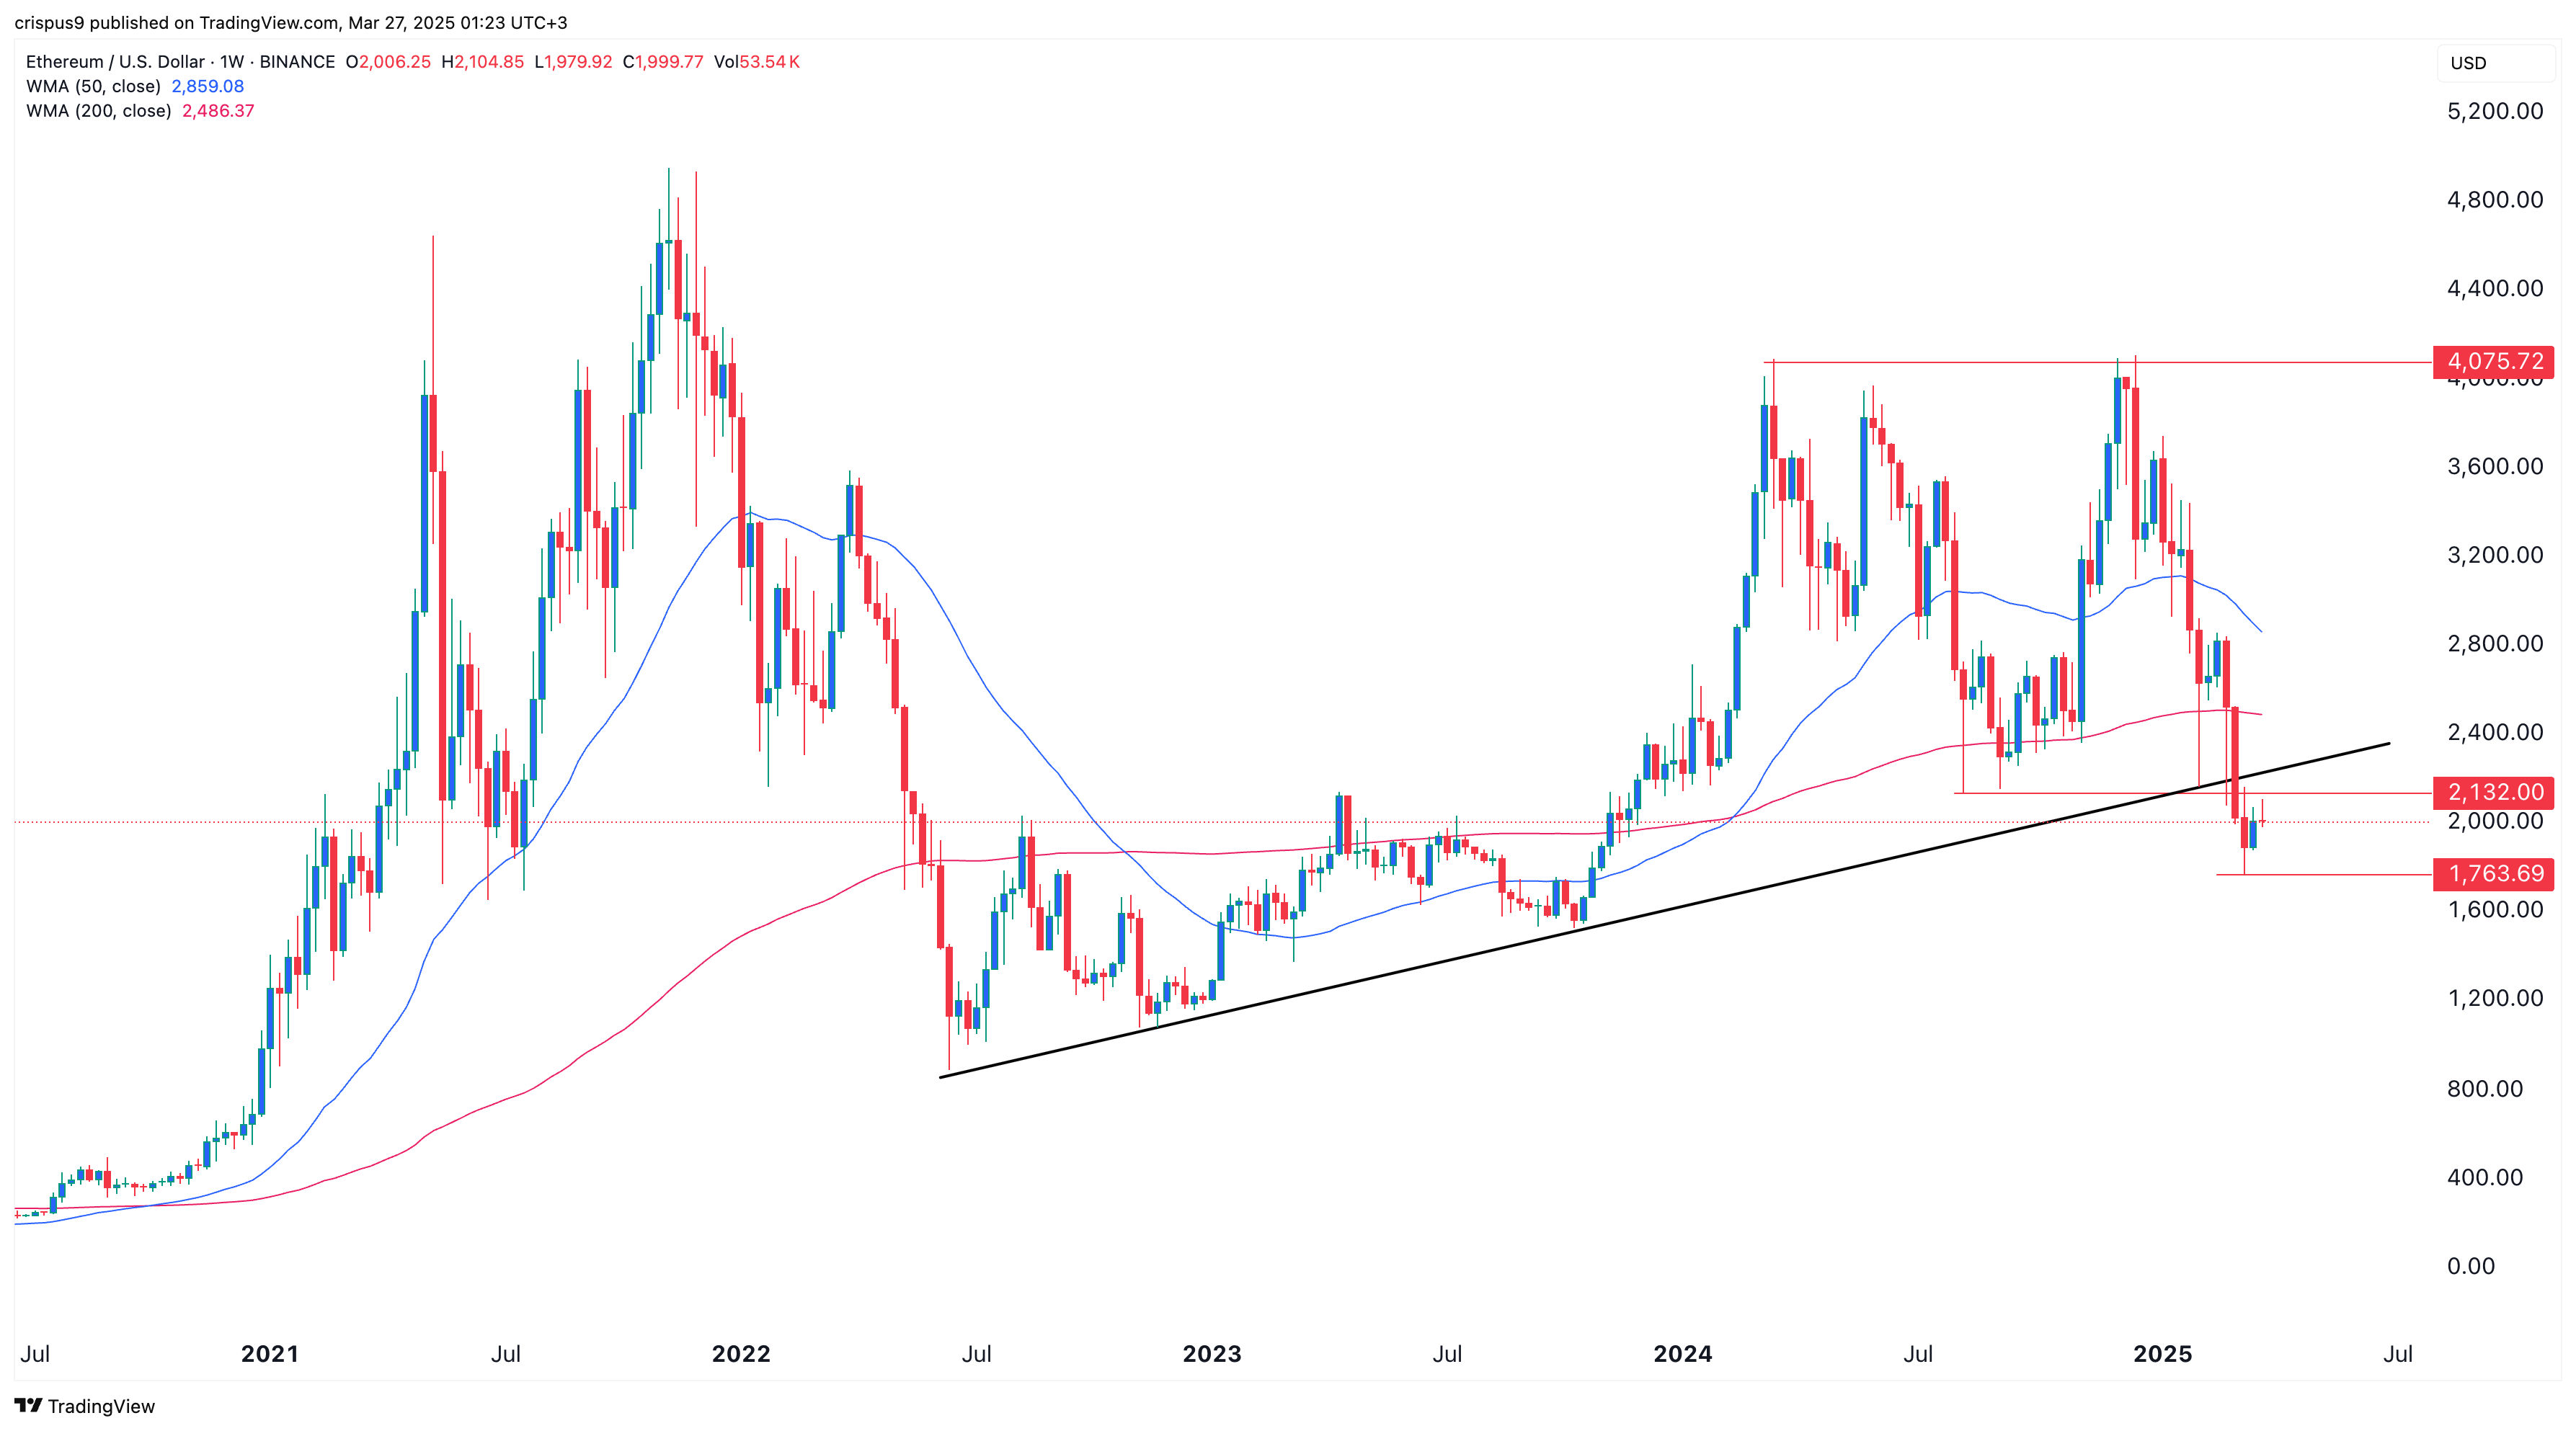
The weekly chart presents a concerning outlook for the price of Ethereum. ETH price formed a triple-top pattern around the $4,000 level. It initially rose to that level in March 2024 and then retested it in May and November of last year. Failing to move above that level signaled investors were wary of placing bids above $4,000.
A triple top comprises two key parts: the top level and a neckline, which, in this case, is $2,138. The bearish outlook is usually confirmed when it moves below the neckline, which Ethereum has done. More downside is then confirmed when it retests that neckline. ETH retests that neckline this week.
Additionally, Ethereum’s price has plunged below the ascending trendline connecting the lowest swings since July 2022. Before this recent decline, the coin typically rebounded whenever it retested that trendline.
ETH has also fallen below the 50-week and 200-week moving averages. Therefore, the weekly chart has more downsides. Measuring the distance between the upper side and the neckline and extrapolating that distance from the neckline indicates a drop to $1,140.
READ MORE: HMSTR Price at Risk as Hamster Kombat L2 Transactions Dive
Ethereum Price Daily Chart Forecast
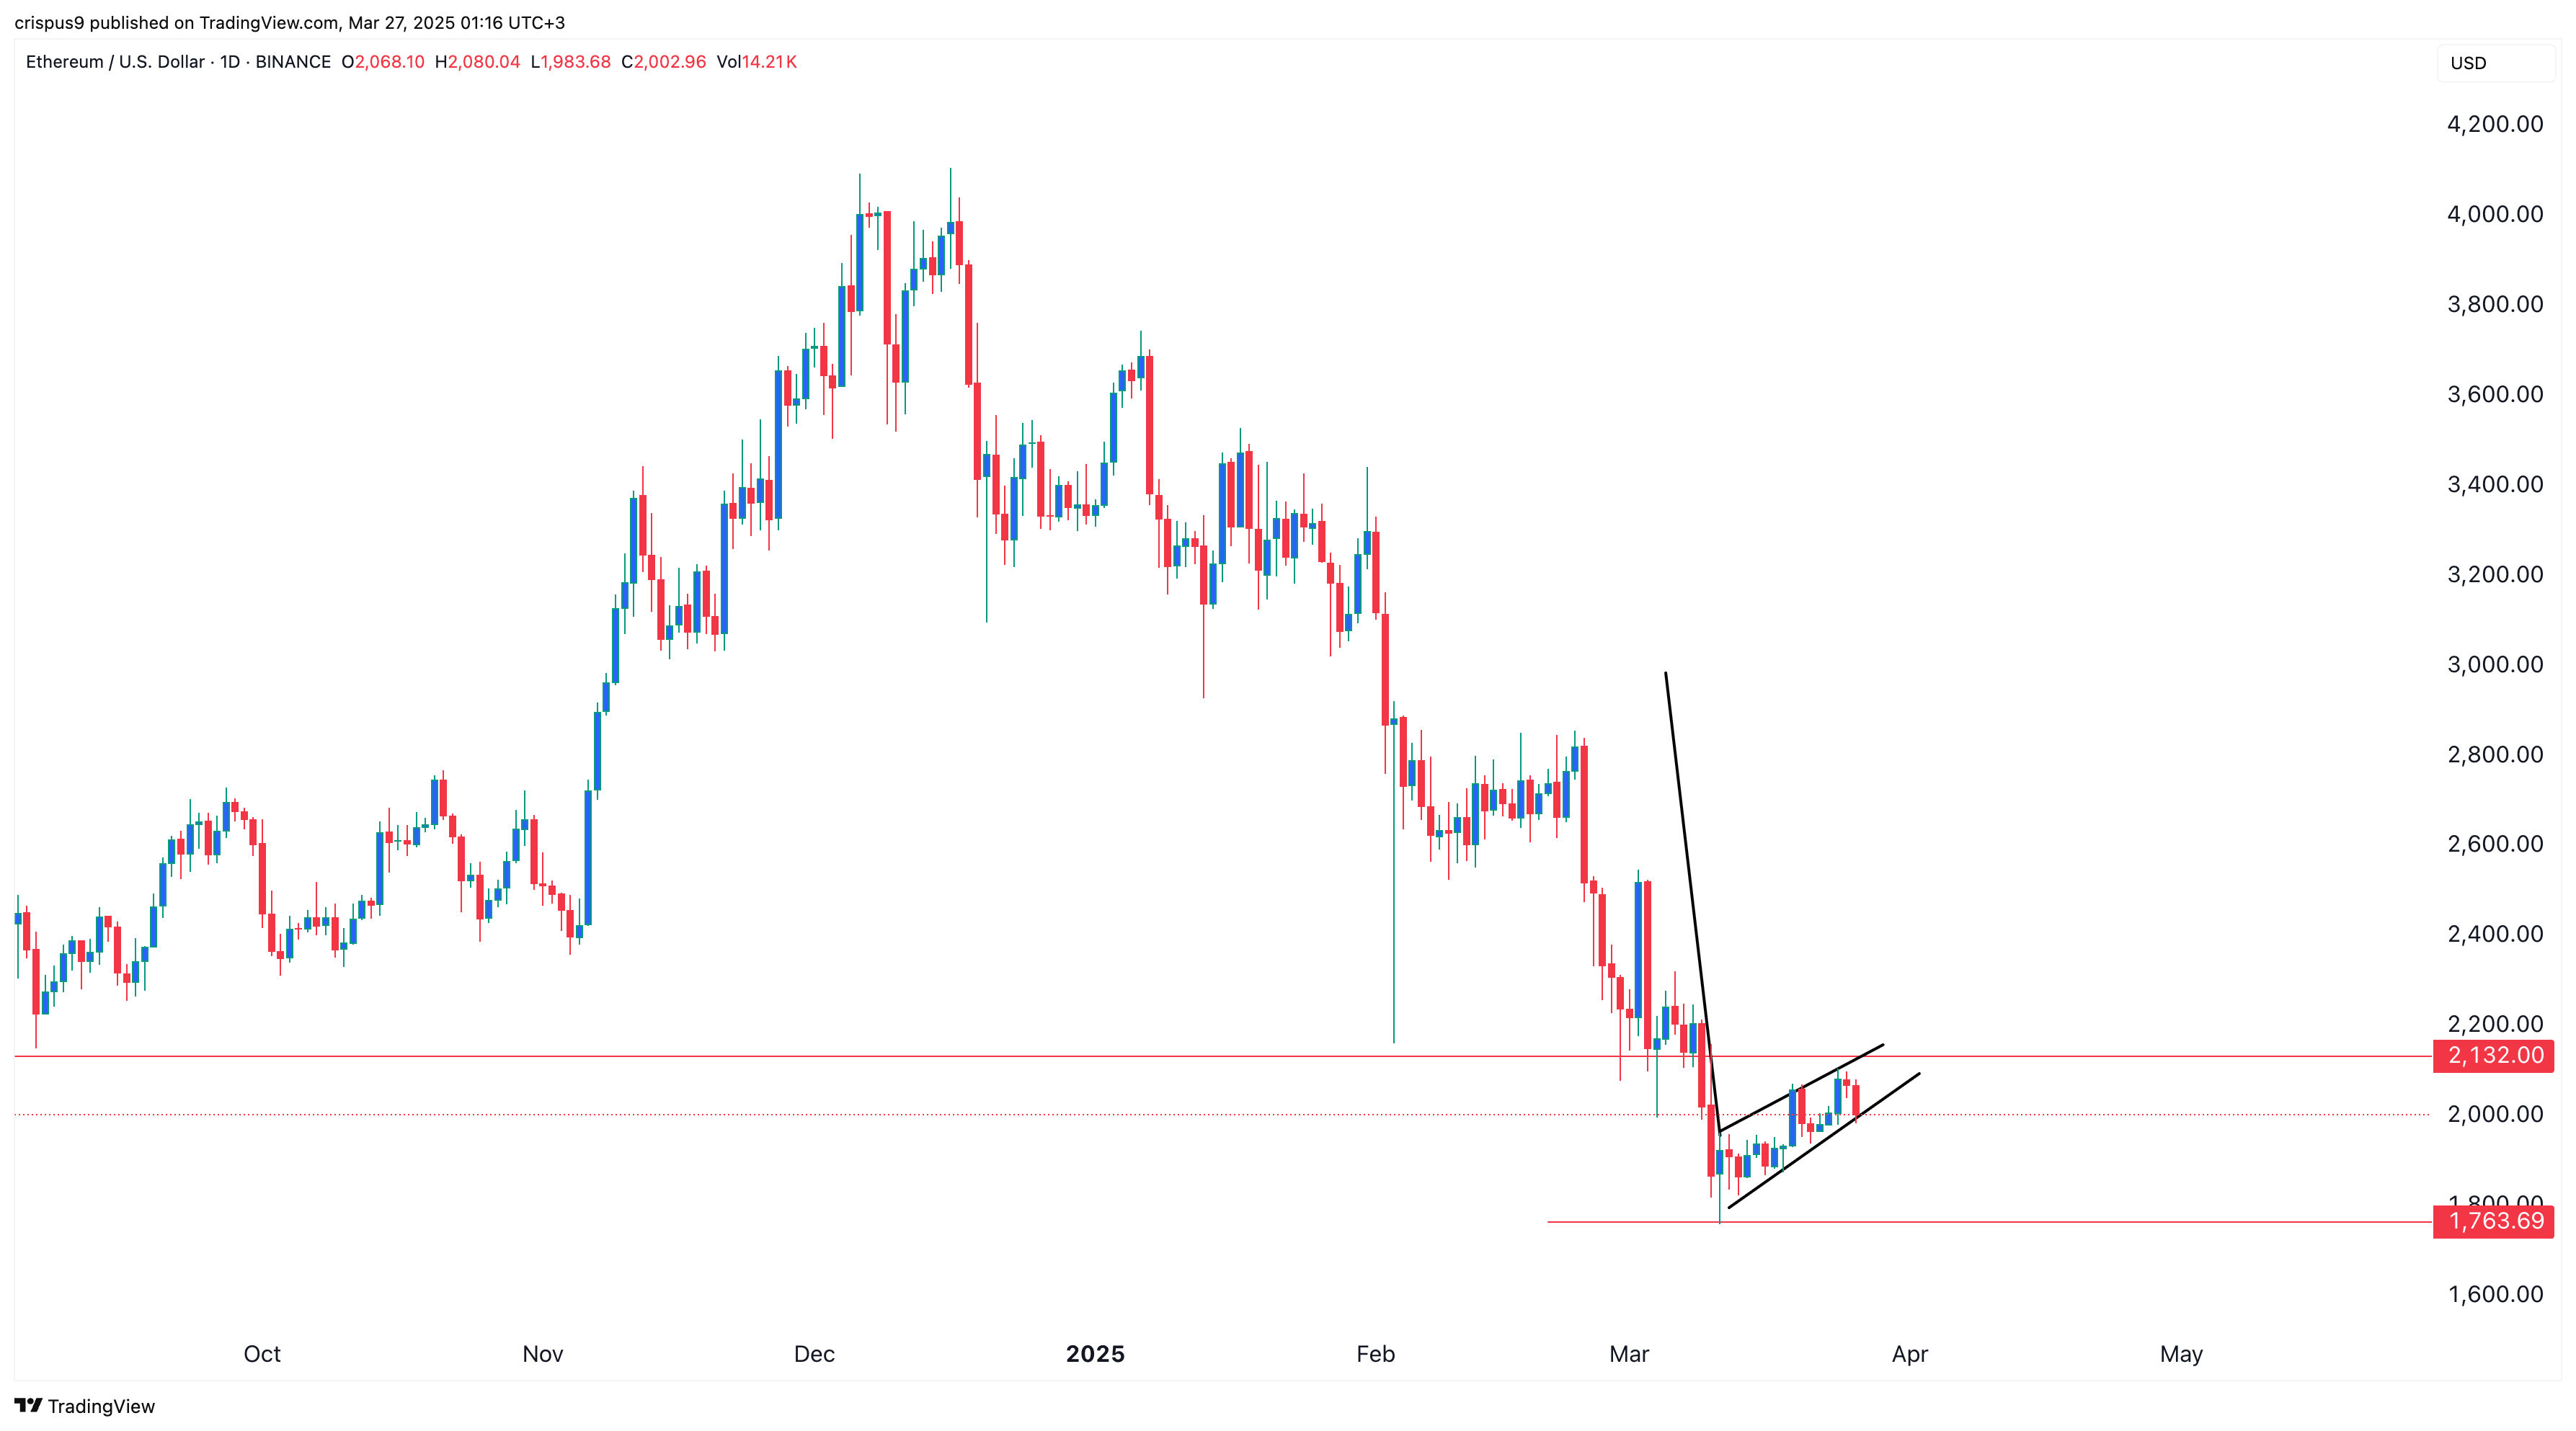
The daily chart shows that the ETH coin has stabilized in the past few days as it moved from a low of $1,763 to a high of $2,130. It has remained below the 50-day moving average, indicating that bears are in control for now.
The coin has formed a bearish flag pattern, which is a popular continuation indicator. This pattern consists of a long vertical line and a rectangle pattern. When this happens, it often leads to a strong bearish breakdown.
The Ethereum price has formed a rising wedge pattern, comprising two ascending and converging trendlines. Therefore, the coin will likely experience a strong bearish breakdown in the coming days. If this happens, the initial target to watch will be at $1,763, its lowest point this month.
Conversely, if the Ethereum price moves above the key resistance point at $2,500, it would invalidate the bearish outlook and increase the likelihood of reaching $3,000.
READ MORE: Buy, Hold, or Sell? Shiba Inu Price Prediction for April 2025


