


The Shiba Inu price has bounced back in the past two weeks as investors bought the dip and the recent crash ended. The SHIB token rose to a high of $0.000014, up 30% from its lowest point this month. It is hovering at its highest level since March 3.
Shiba Inu Price Analysis: 4H Chart Outlook
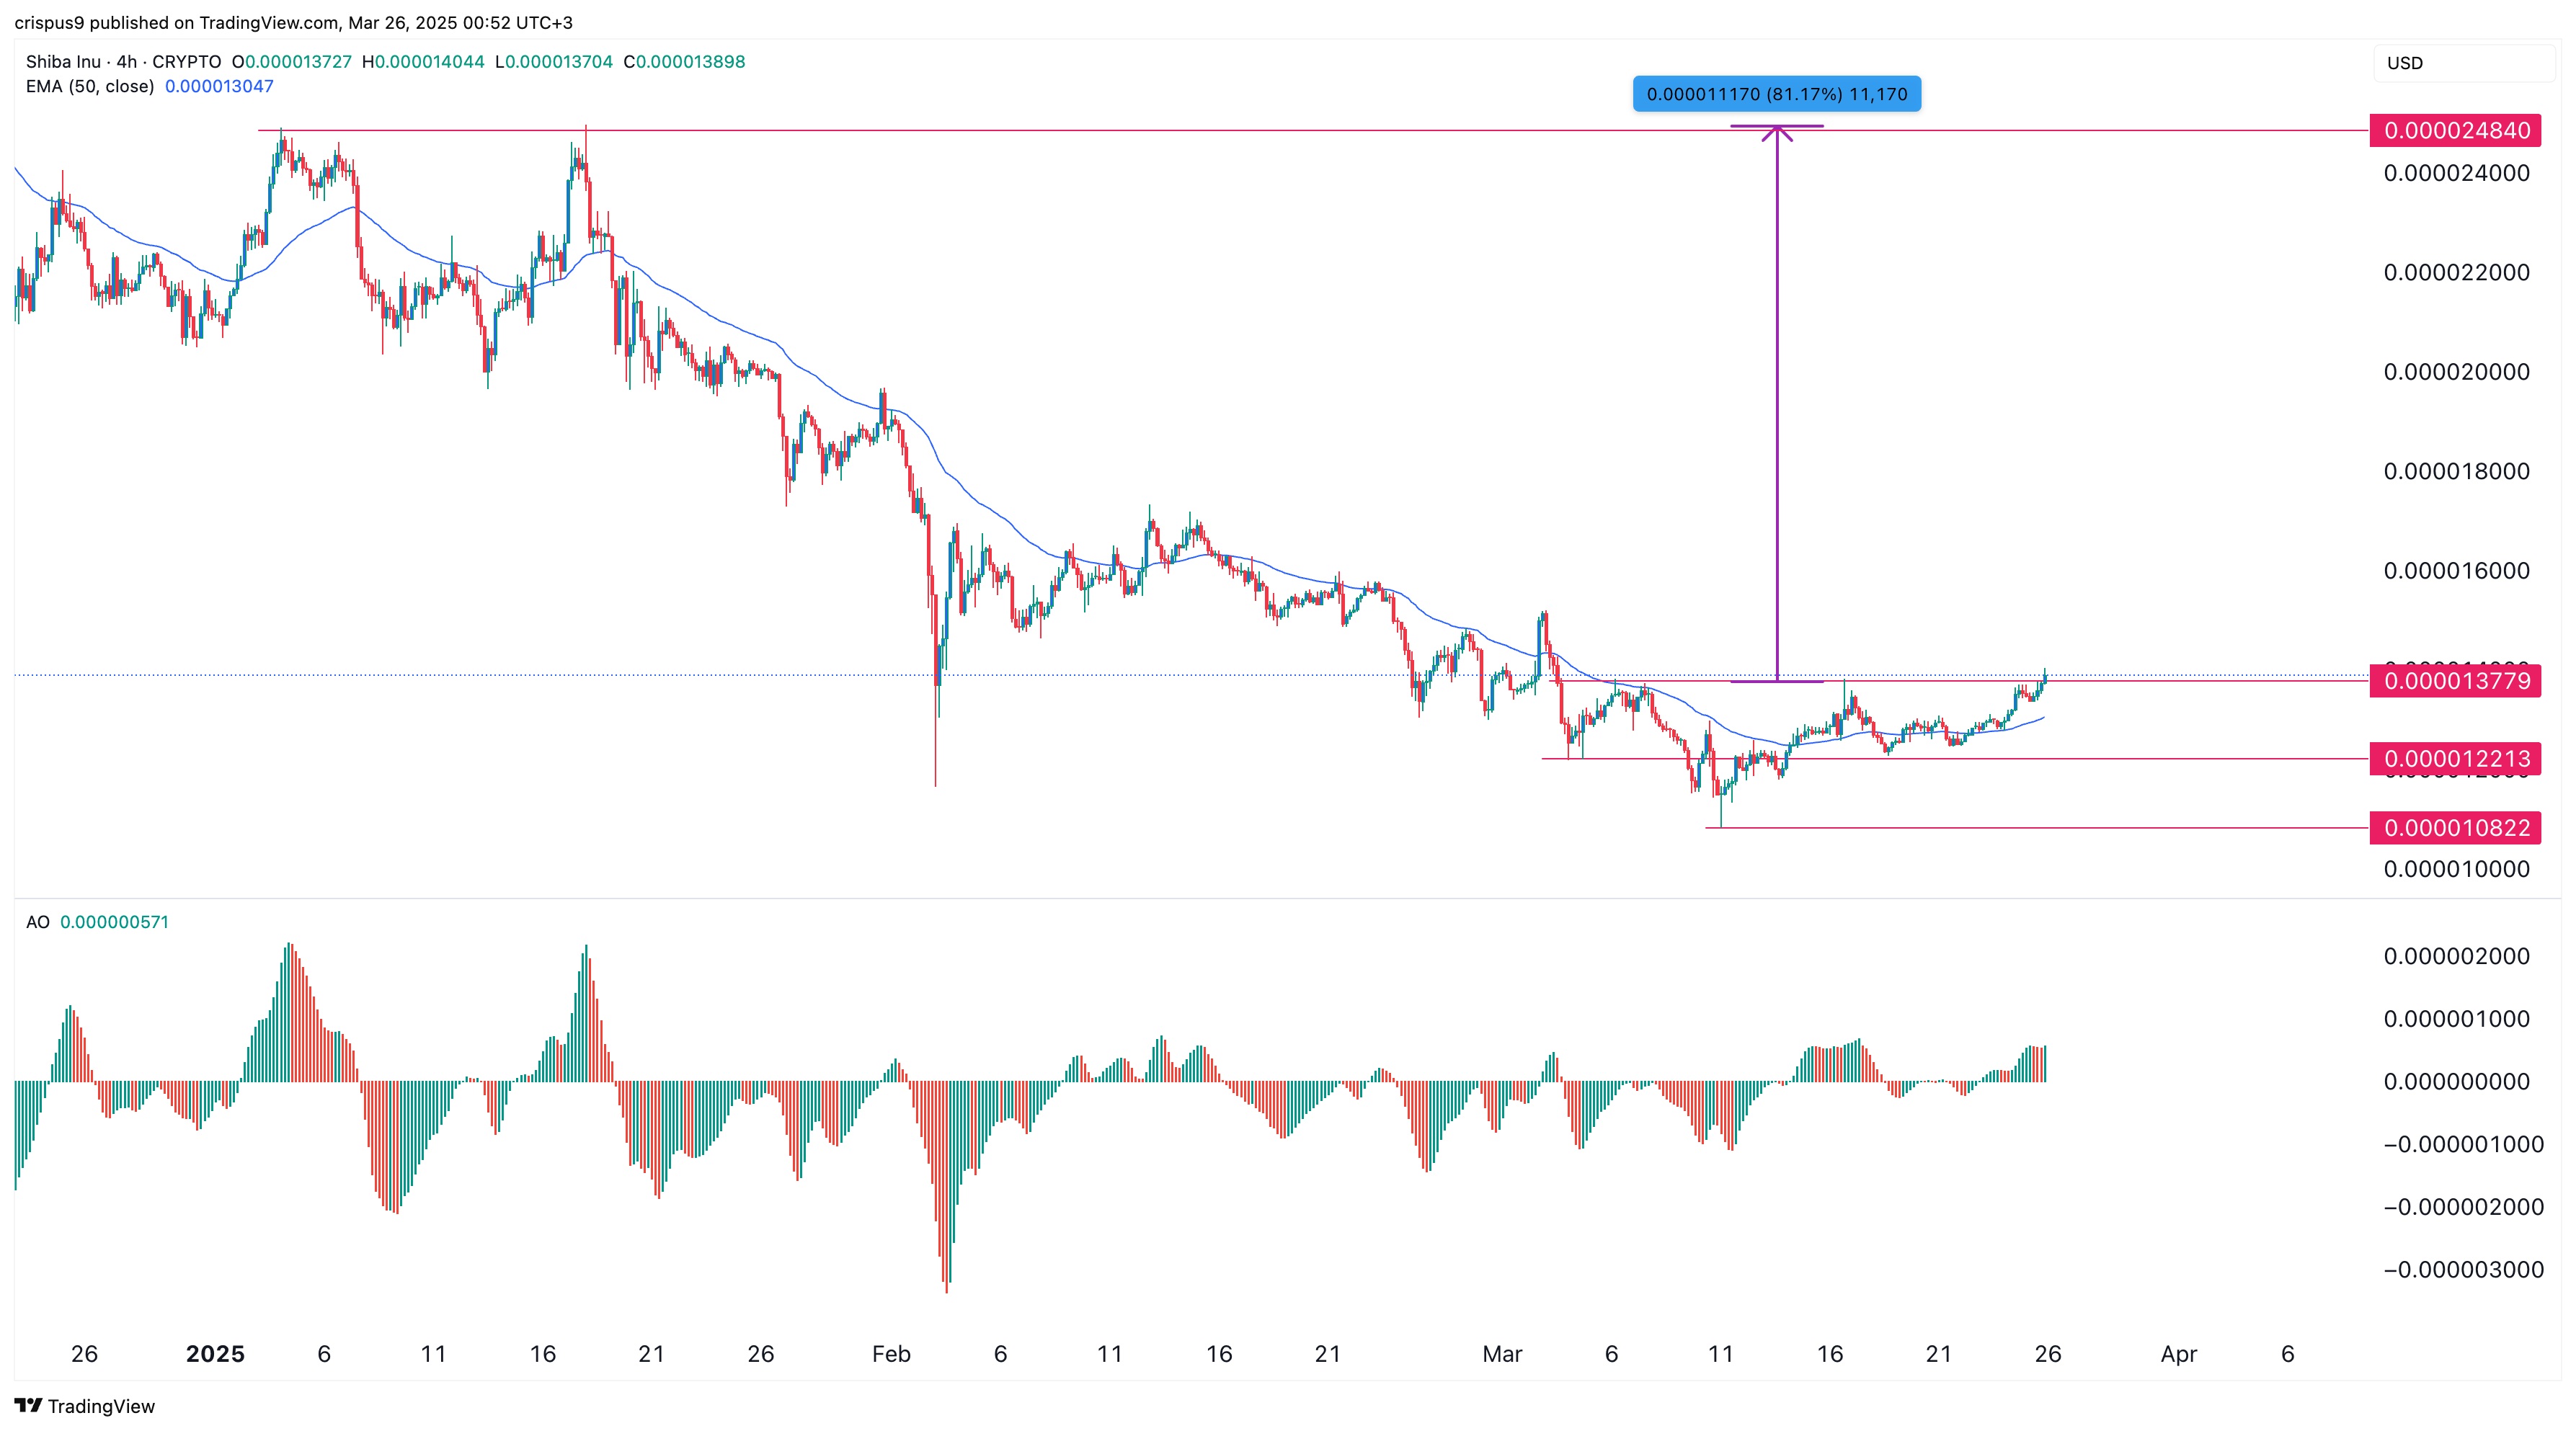
Technical indicators suggest the SHIB price is on the verge of a strong bullish breakout. It has already surged from a low of $0.0000108 on March 10 to $0.000014.
The meme coin has formed an inverse head and shoulders pattern, one of the most bullish patterns in technical analysis. This pattern comprises a head at $0.0000108, two shoulders at $0.00001220, and a neckline at $0.00001377.
The SHIB price has now moved above the neckline and is gaining momentum, as the Awesome Oscillator indicator has remained above the zero line since March 19. Other oscillators, like the Relative Strength Index (RSI) and the Average Directional Index (ADX), have jumped.
The Shiba Inu price has exceeded the 50-period moving average, indicating that bulls are in control. Therefore, the coin will likely continue rising as bulls target the key resistance point at $0.00002484, its highest point on January 4 and 18.
SHIB Price Daily Chart Analysis
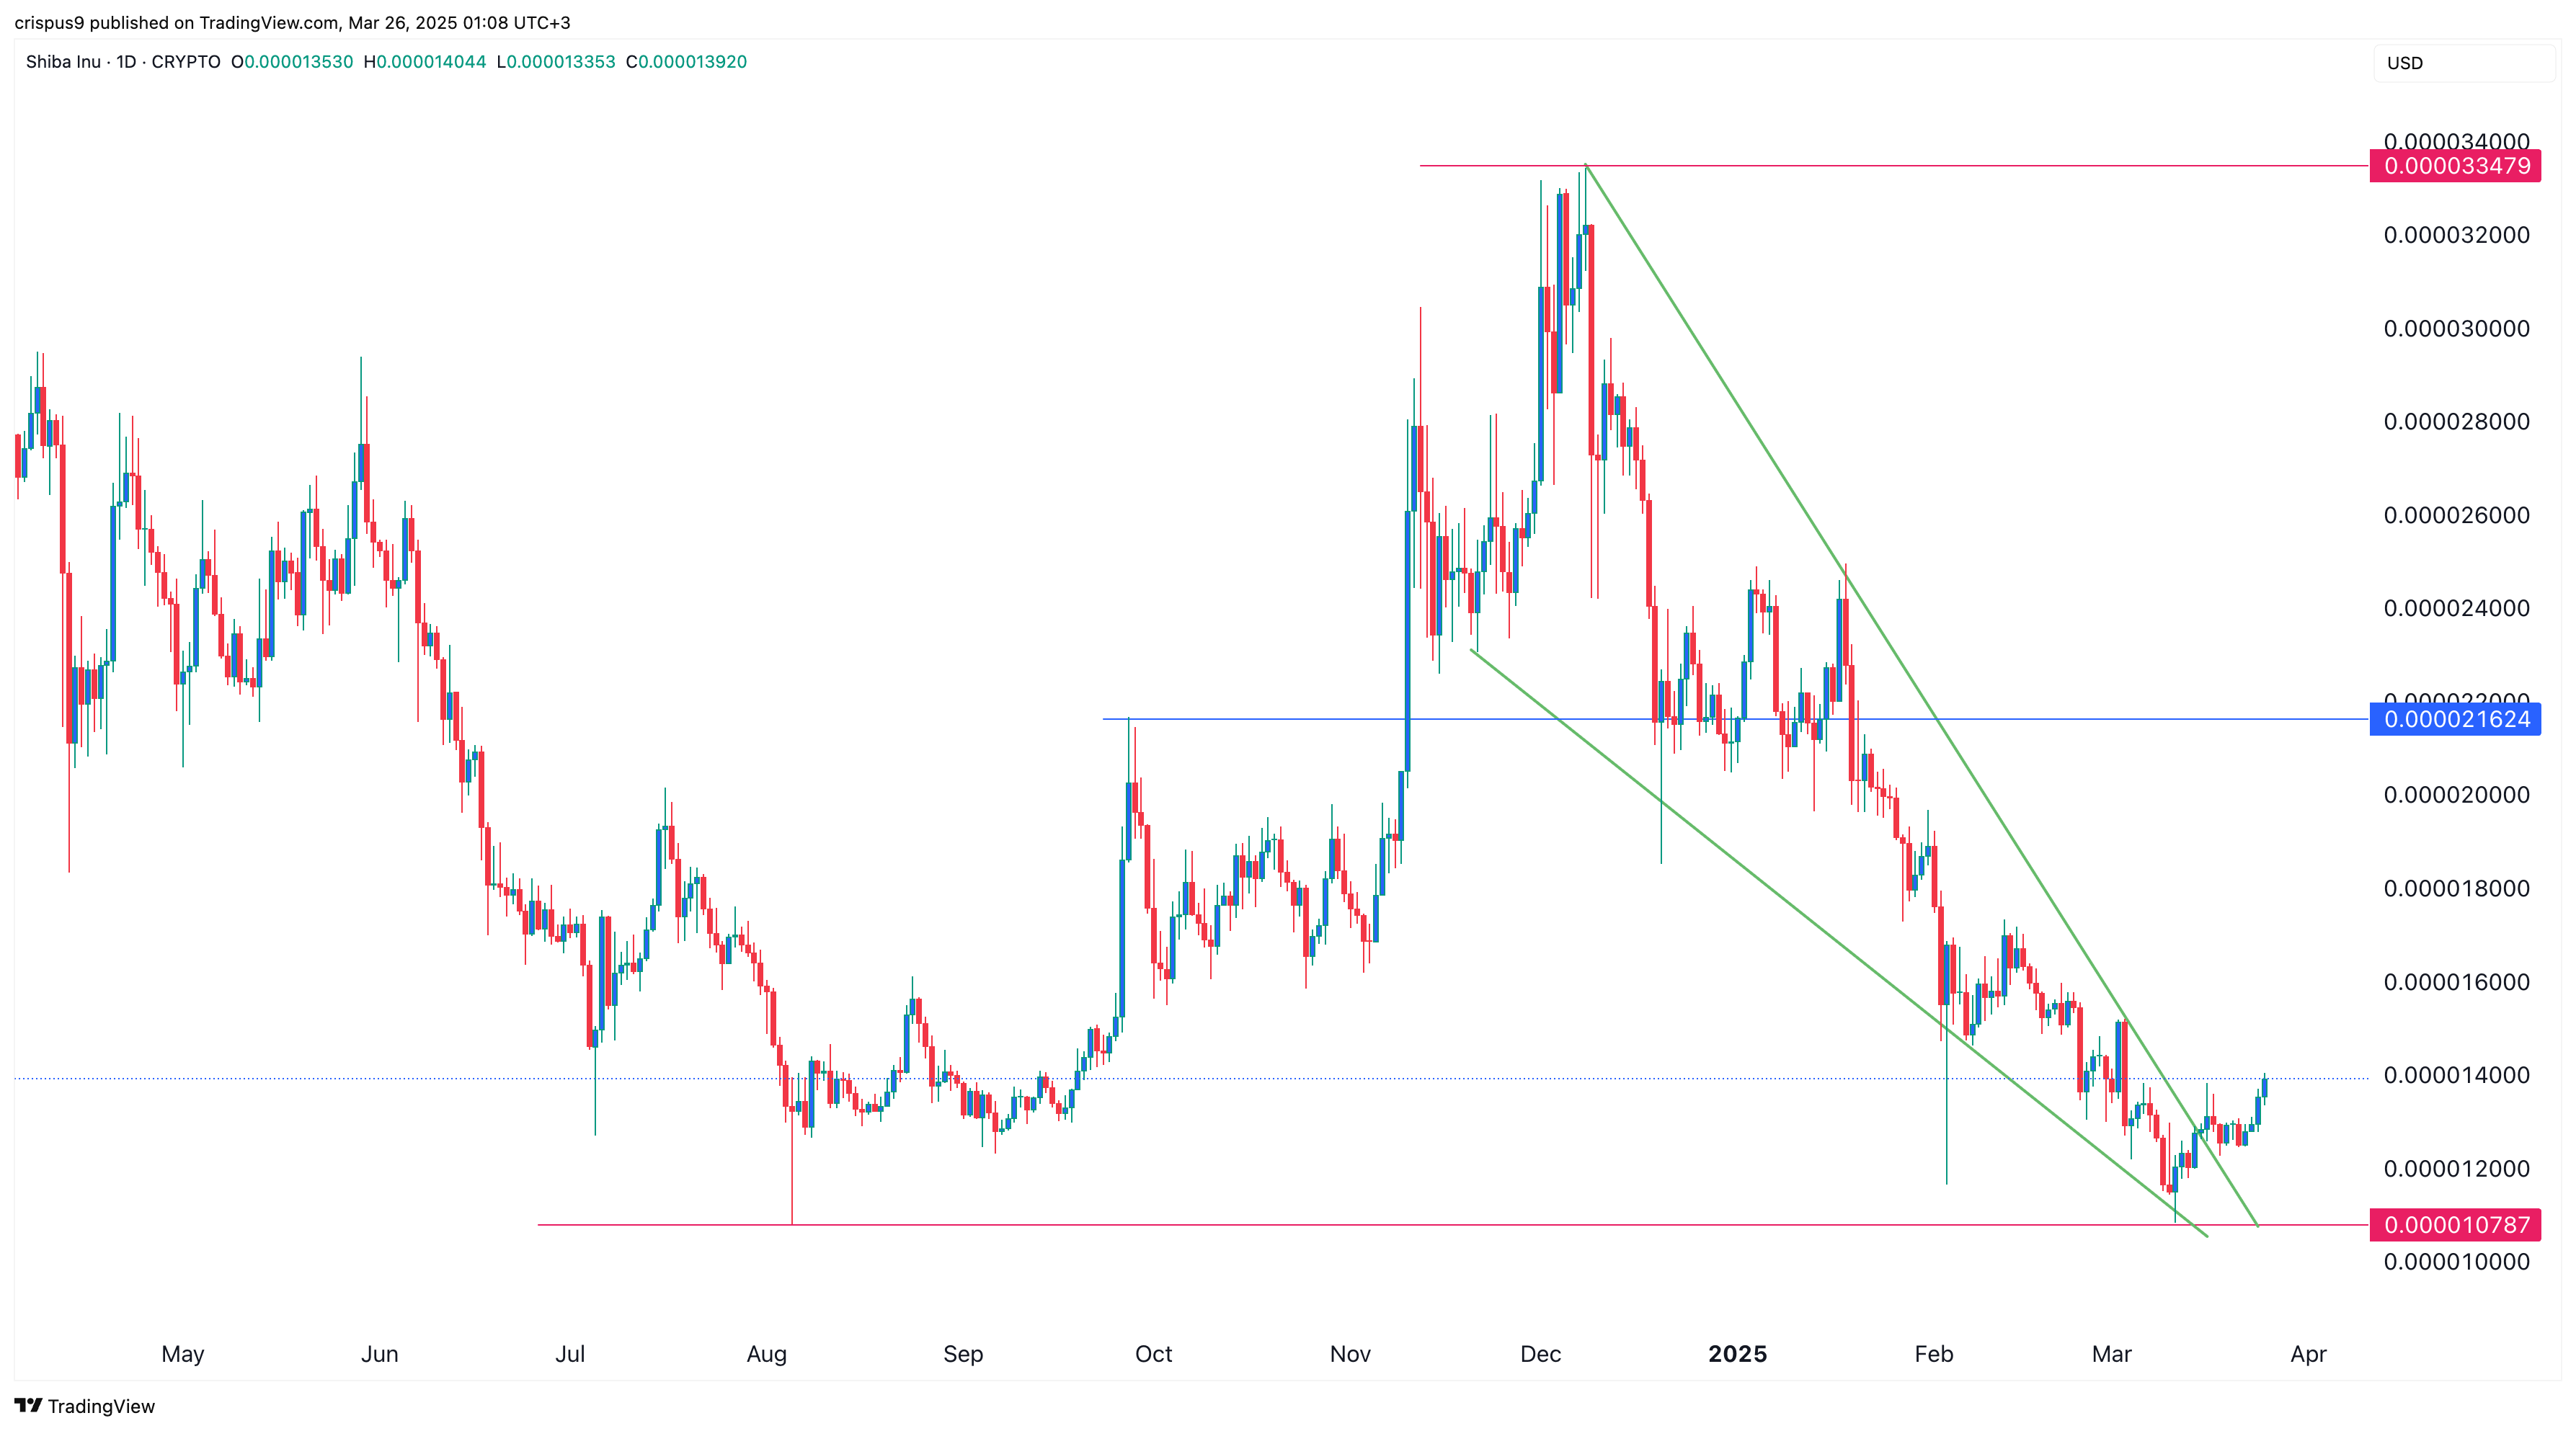
Shiba Inu’s daily chart is even more encouraging than the four-hour one. It formed a giant double-bottom pattern at $0.000010 in August last year and March this year. This pattern is made up of two down-peaks and a neckline.
In Shiba Inu’s case, the neckline is at $0.0000335, its highest level on December 8 last year, about 145% above the current level. The coin has also formed a giant falling wedge pattern, which is shown in green on the chart below.
As with the 4H chart, the coin has formed a bullish divergence pattern as the Relative Strength Index (RSI) and the MACD have pointed upward. Therefore, the coin will likely have a strong bullish breakout, with the initial target at $0.00002162, its highest point on September 27, up by 56% above the current level.
Buy, Sell, or Hold SHIB?
Technical indicators suggest that Shiba Inu is a solid buy in March and April of this year. However, this bullish outlook will become invalid if the coin crashes below the neckline at $0.00001078. Such a move will invalidate the double bottom and the inverse head-and-shoulders pattern and point to more downside.
READ MORE: Crypto Analyst Explains Why Shiba Inu Price May Surge 83,000%