


Cryptocurrency prices may be at risk as technicals point to a potential crash of American stocks amid the escalating trade war. Bitcoin was trading at $90,000 on Thursday, while other popular altcoins like Chainlink (LINK) and Cardano (ADA) stabilized. Now that the Dow Jones index has formed a double top, what lies ahead for these coins?
Dow Jones Forms a Perfect Double-Top Pattern
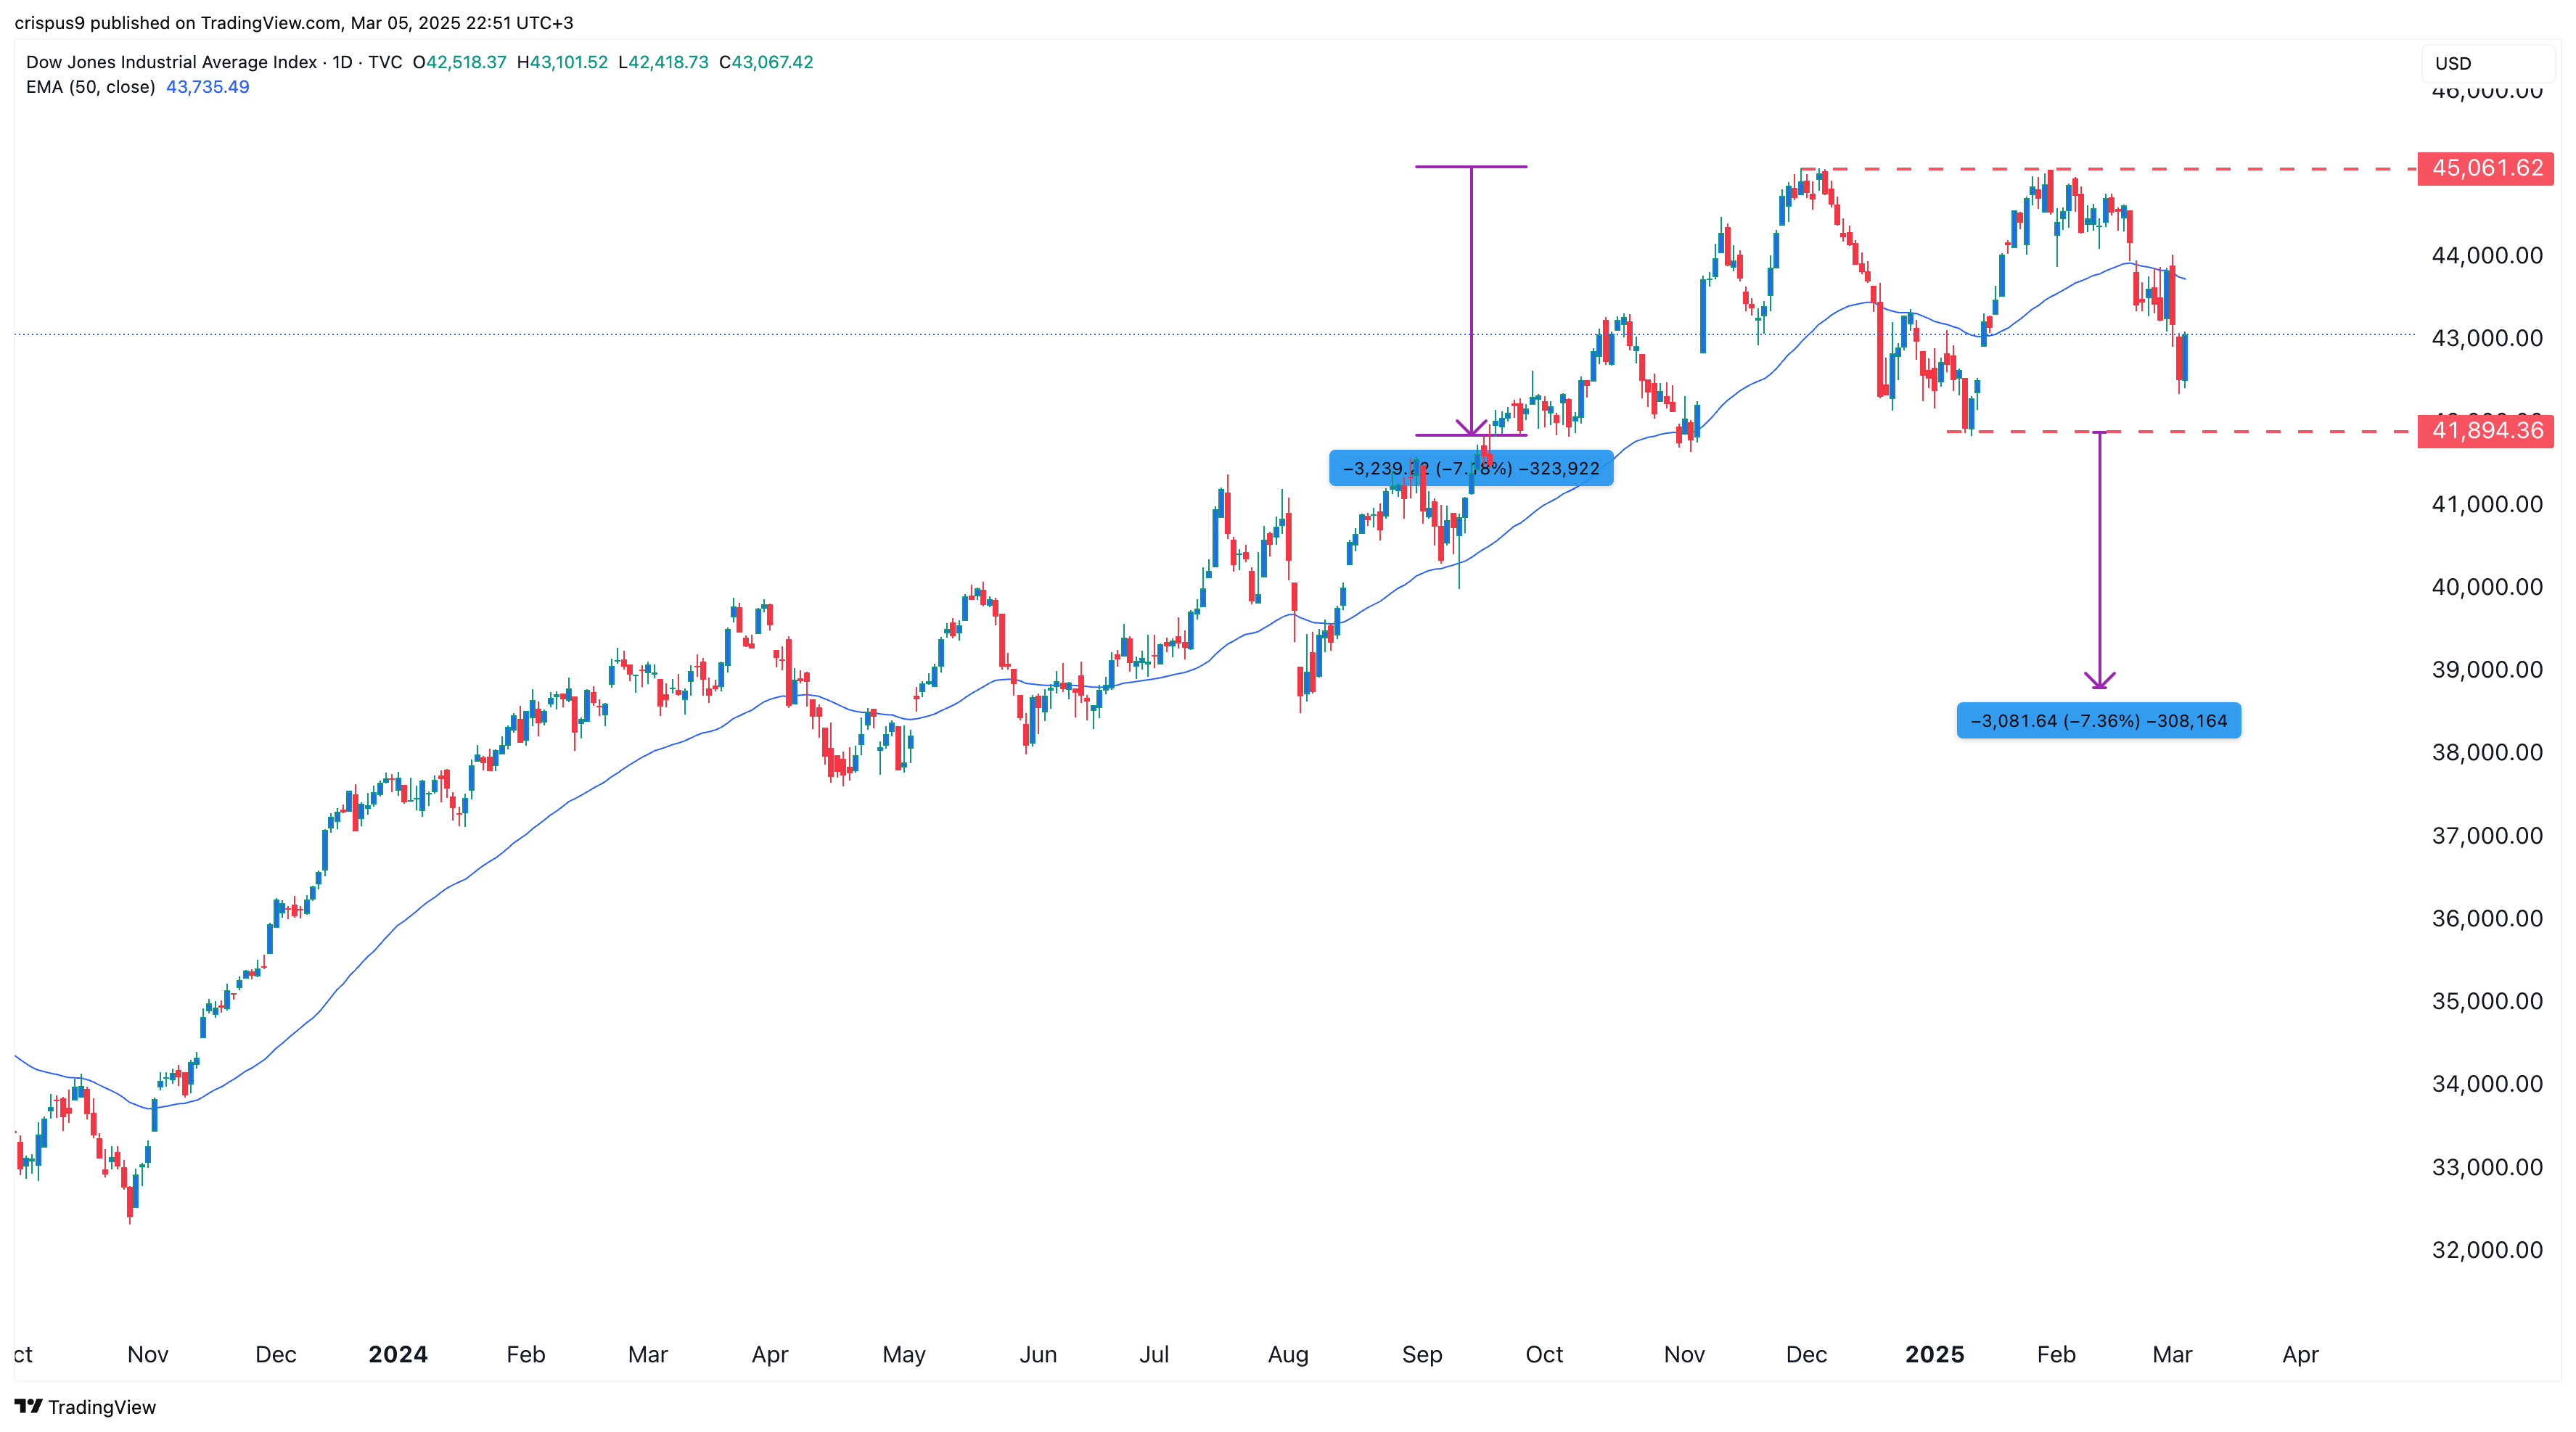
There is a rising risk that the Dow Jones index is about to have a deeper reversal, a move that may affect other assets like cryptocurrencies. The chart below shows that the index has encountered a strong barrier at $45,061, where it failed to move above in December and January.
A double-top is made up of twin peaks and a neckline, which is at $41,895 in this case. This pattern points to a strong bearish breakdown, with the next viable reference level being the psychological point at $40,000, which is about 7.12% below the current level. A drop below that level will point to further downside to $38,800.
The bearish Dow Jones forecast will become invalid if it rises above the double-top pattern at $45,060.
Other US stock indices have also emitted a bearish signal. For example, the S&P 500 index has formed a double-top and a rising wedge, pointing to further downside.
On the positive side, the falling US bond yields and US dollar index mean that the Federal Reserve may intervene and cut interest rates, which would boost stocks. In a note to BanklessTimes, Garrison Yang of Mirai Labs said:
“We’ll continue to see a lot of headline-driven price action on BTC. Trump’s tweet on the strategic reserve was sold, while price action due to tariff advancement and rollback seems to stick. This is an indicator of what matters more to BTC traders. The next line in the sand that determines longer-term direction is the March FOMC, and we will see whether or not Trump’s gambit to force rates down has worked.”
Bitcoin Price Technical Analysis
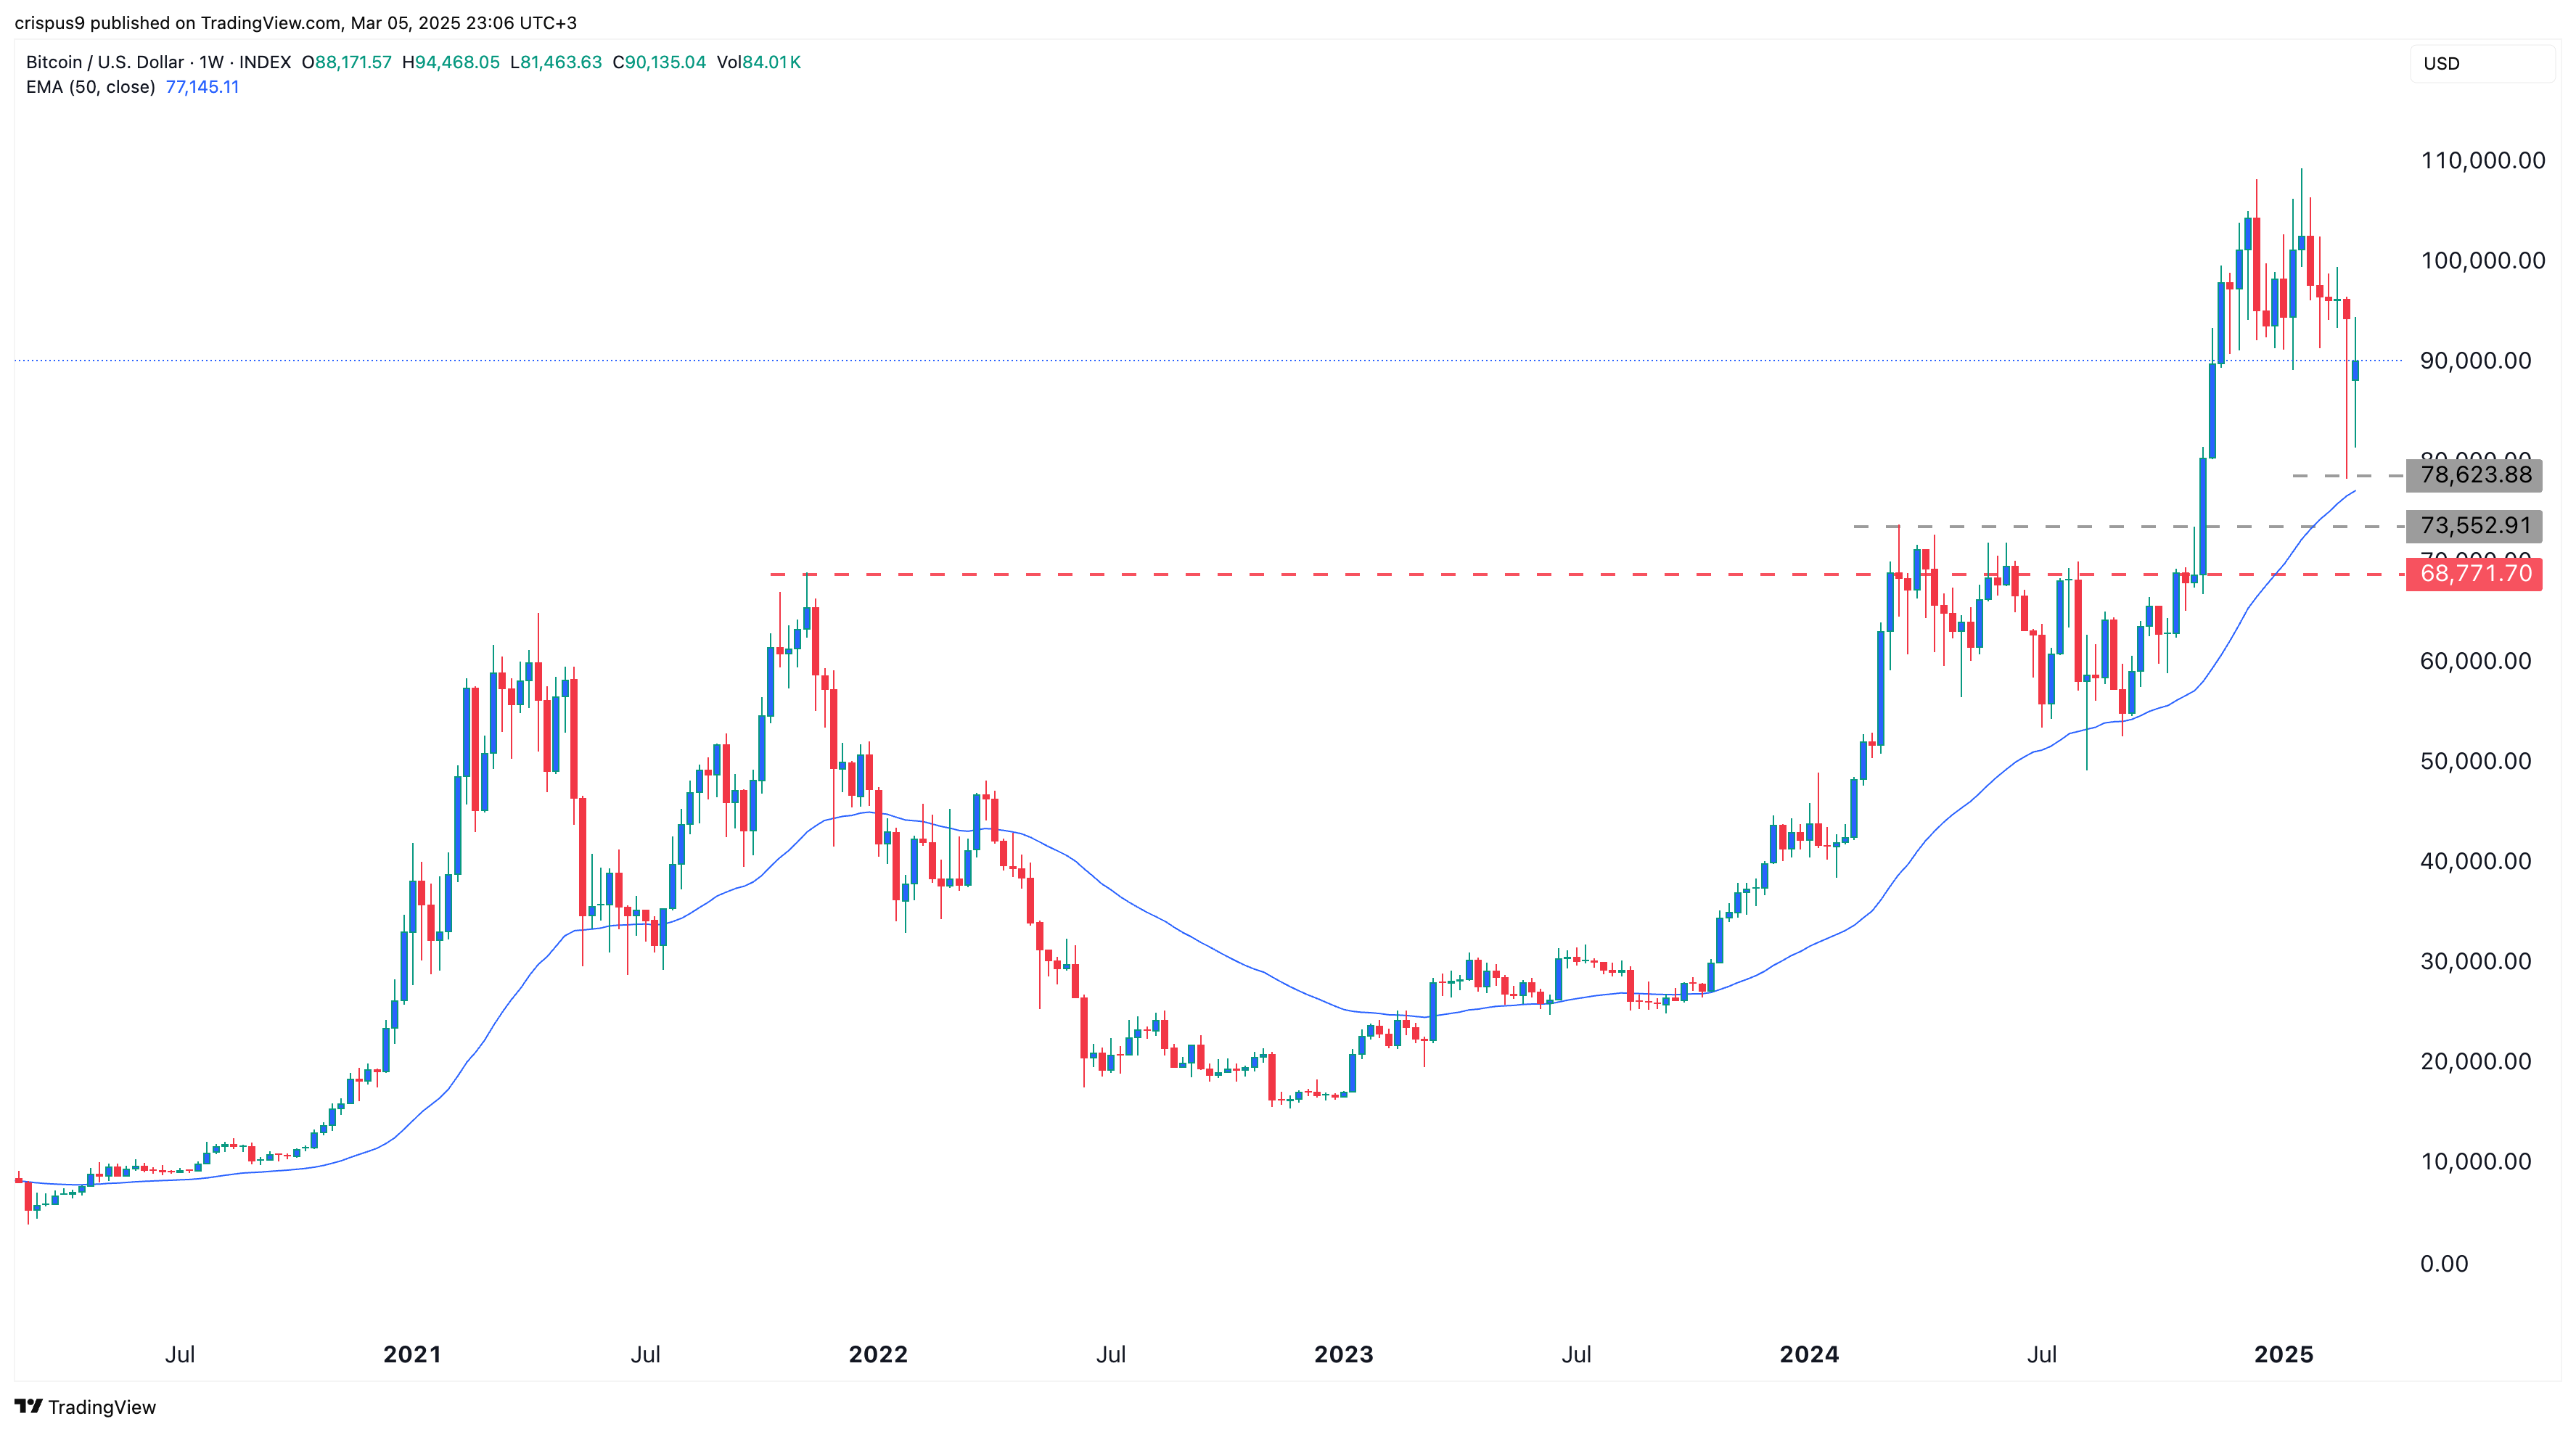
The weekly chart shows that Bitcoin price has been under pressure in the past few days. It has remained slightly above the 50-week moving average at $77,140. Bitcoin has also moved above the key resistance level at 73,552, the upper side of the cup and handle pattern completed in November.
Bitcoin is forming a morning star candlestick pattern, which suggests a potential rebound to over $100,000. A drop below the key support at 78,620 will invalidate the bullish view as it will signal that bears have prevailed.
Bitcoin has a key fundamental catalyst: Donald Trump will propose a strategic BTC Reserve on Friday.
Cardano Price Analysis
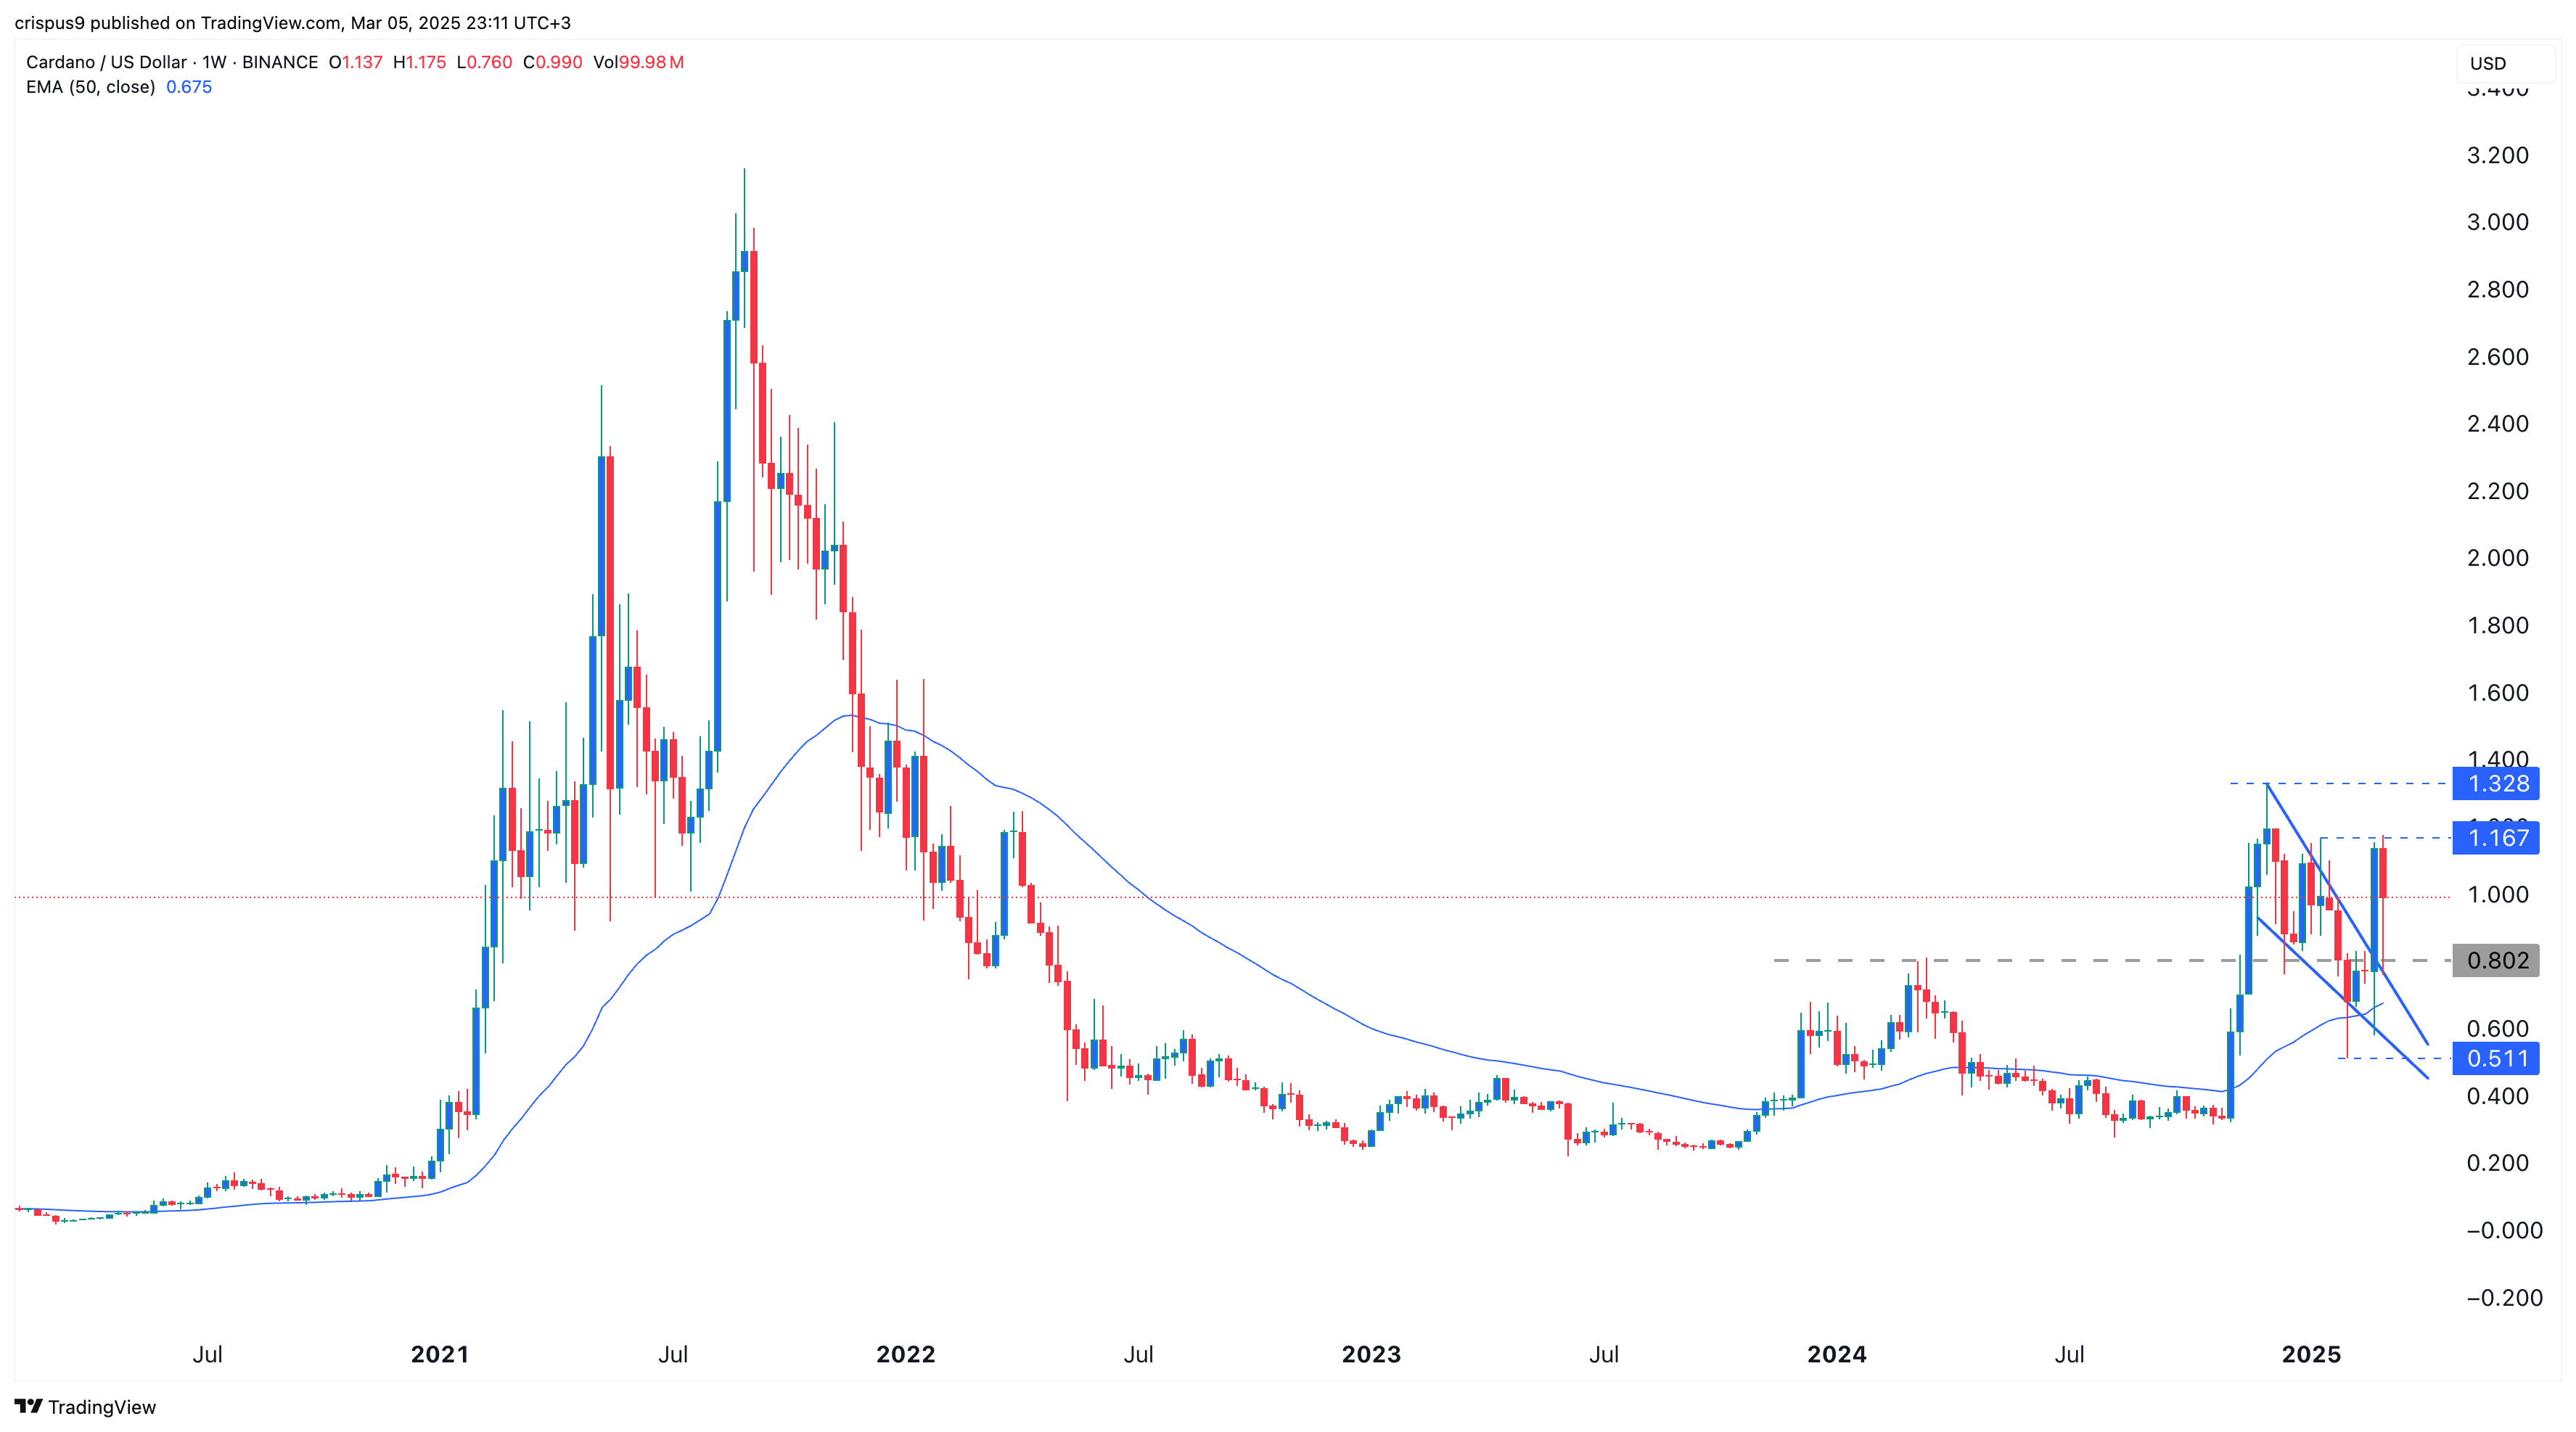
The weekly chart shows that the Cardano price may be preparing for a massive surge. It has moved above the upper side of the falling wedge that formed between December and last month. It then retested that upper side and is now forming a hammer candlestick pattern.
ADA has also retested the crucial support level at $0.80, the highest swing in March 2024. Therefore, the path of least resistance for the coin is bullish, with the initial target to watch being at $1.328. A move above that level will point to more gains, potentially to $2.
Chainlink Price Analysis
The weekly chart shows that the LINK price has retreated from last year’s high of $30 to the current $16. It has formed a falling wedge pattern and is in the process of forming the handle section of the cup and handle pattern. Chainlink price has found strong support at the 50-week moving average.
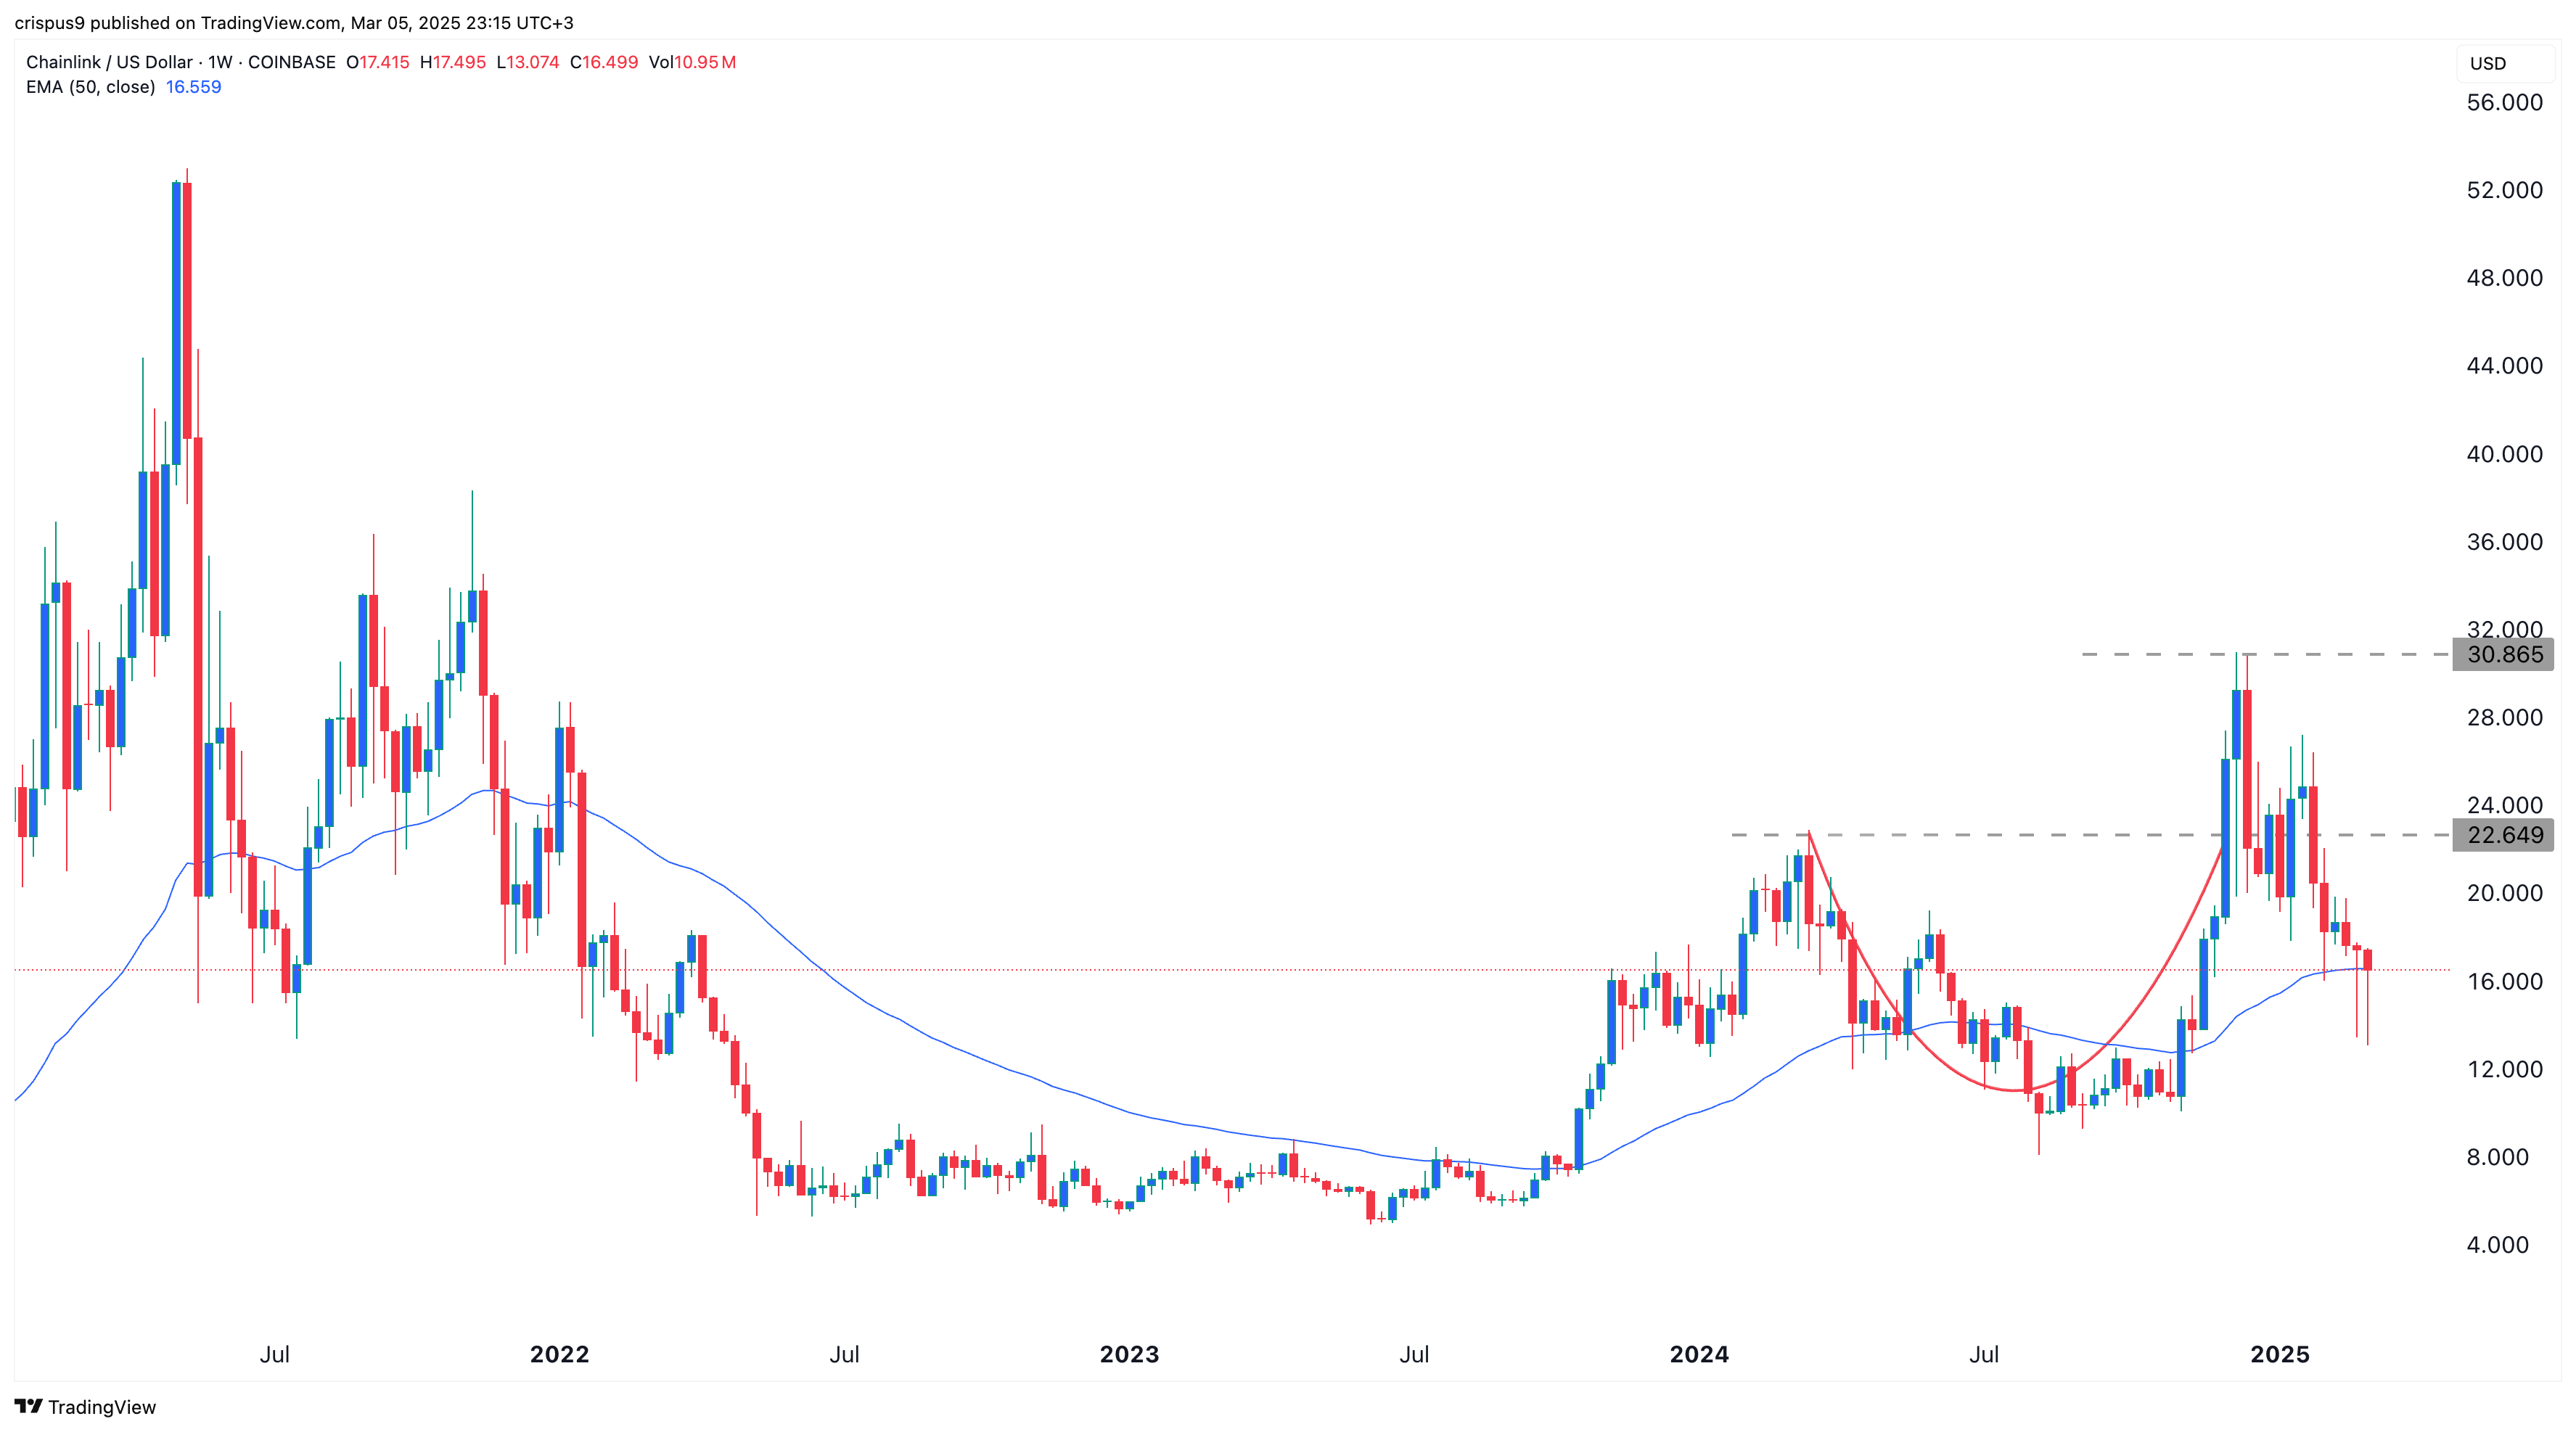
Therefore, the LINK price will likely bounce back and possibly retest the resistance at $22.65, as it is forming a hammer pattern.
READ MORE: Solana Votes on Key Inflation Proposal, But Critics Are Concerned