The ongoing Bitcoin price crash has led to panic among some crypto investors who have started selling their coins. Indeed, spot Bitcoin ETFs have suffered outflows in the last two days, ending a two-week period of intense accumulation that led to cumulative inflows of over $36 billion. Still, the charts below explain why the BTC price surge has more room to run.
1. Bitcoin price always goes up
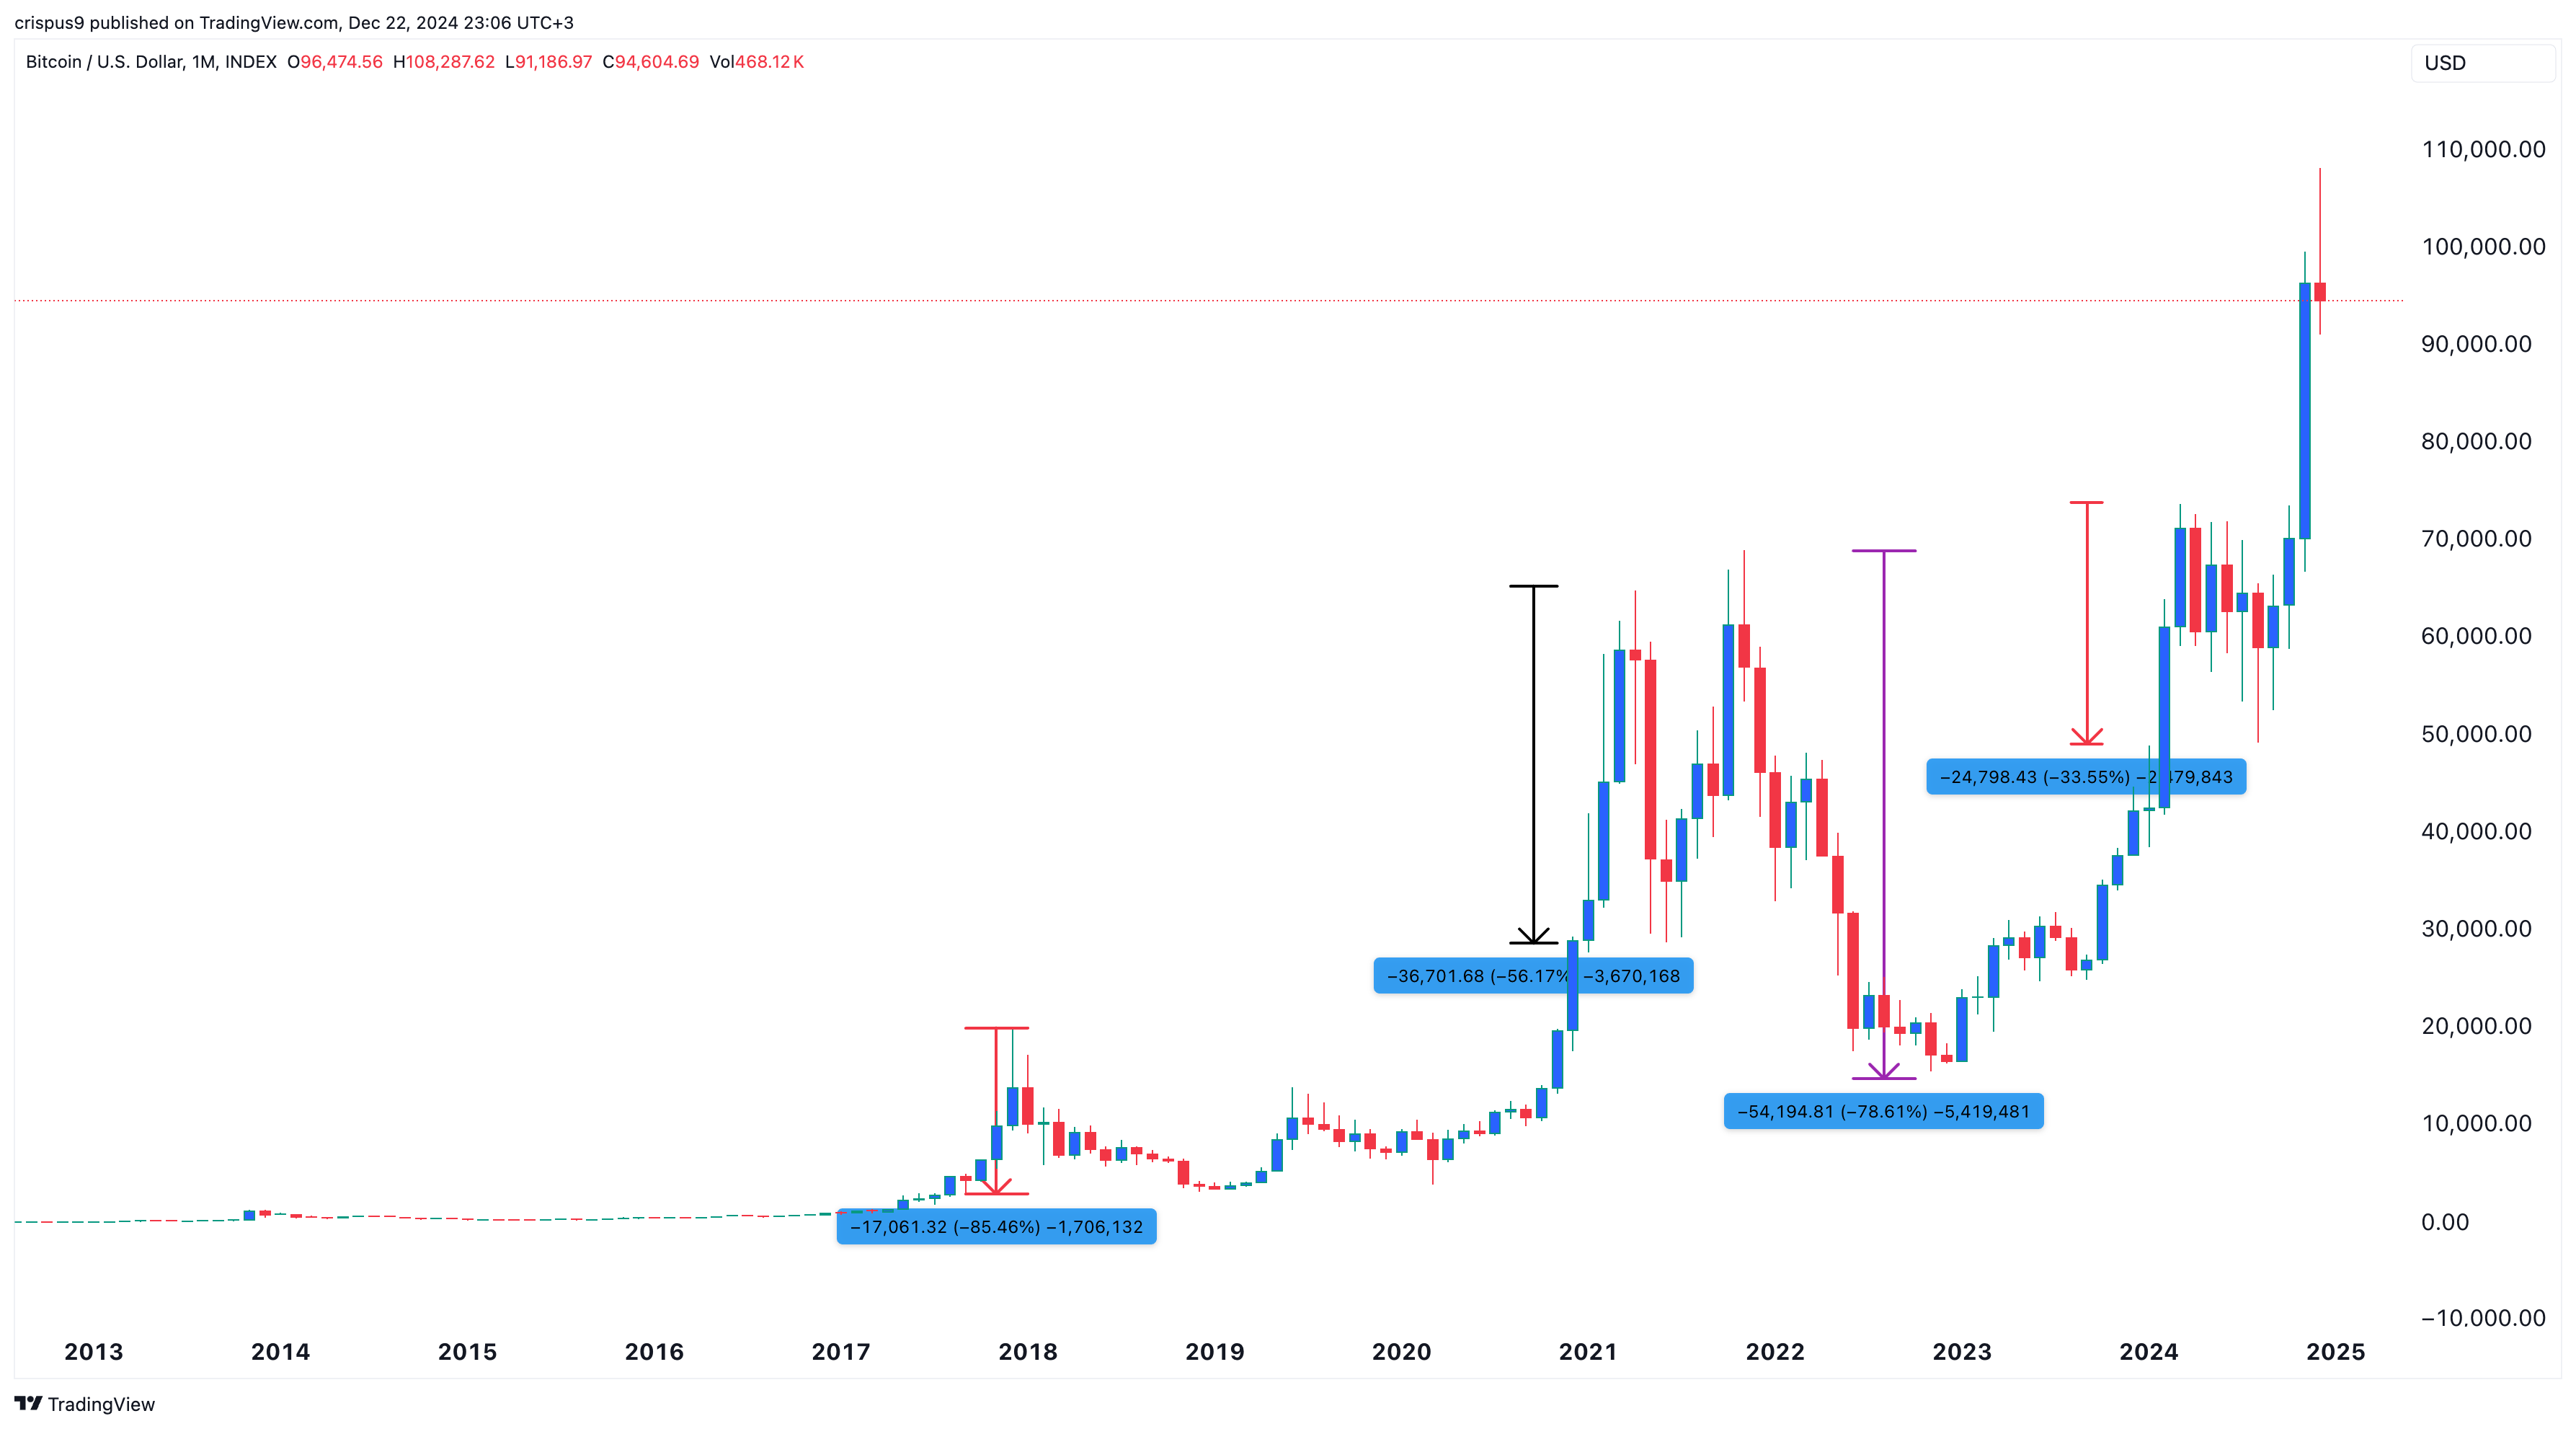
The first and most important chart is the long-term Bitcoin price chart since its inception in 2009. This chart shows that the coin moved from almost zero to a record high of $108,200 last week. The performance makes Bitcoin the best-performing major asset in the world, as it has jumped by over 9.5 million since inception.
Bitcoin’s surge has not been linear, as it has suffered severe corrections in the past. It dropped by 85% from its highest level in 2017 to its lowest point in 2019. Bitcoin then dropped by 56% from its April 2021 high to its June 2021 low and by 78% between November 2021 and March 2022. Most recently, Bitcoin fell by 33% from March to August.
Therefore, while it is too early to tell, we can assume that the Bitcoin price will bounce back again and resume its bullish trend when this crash ends.
2. Bitcoin balances in exchanges are falling
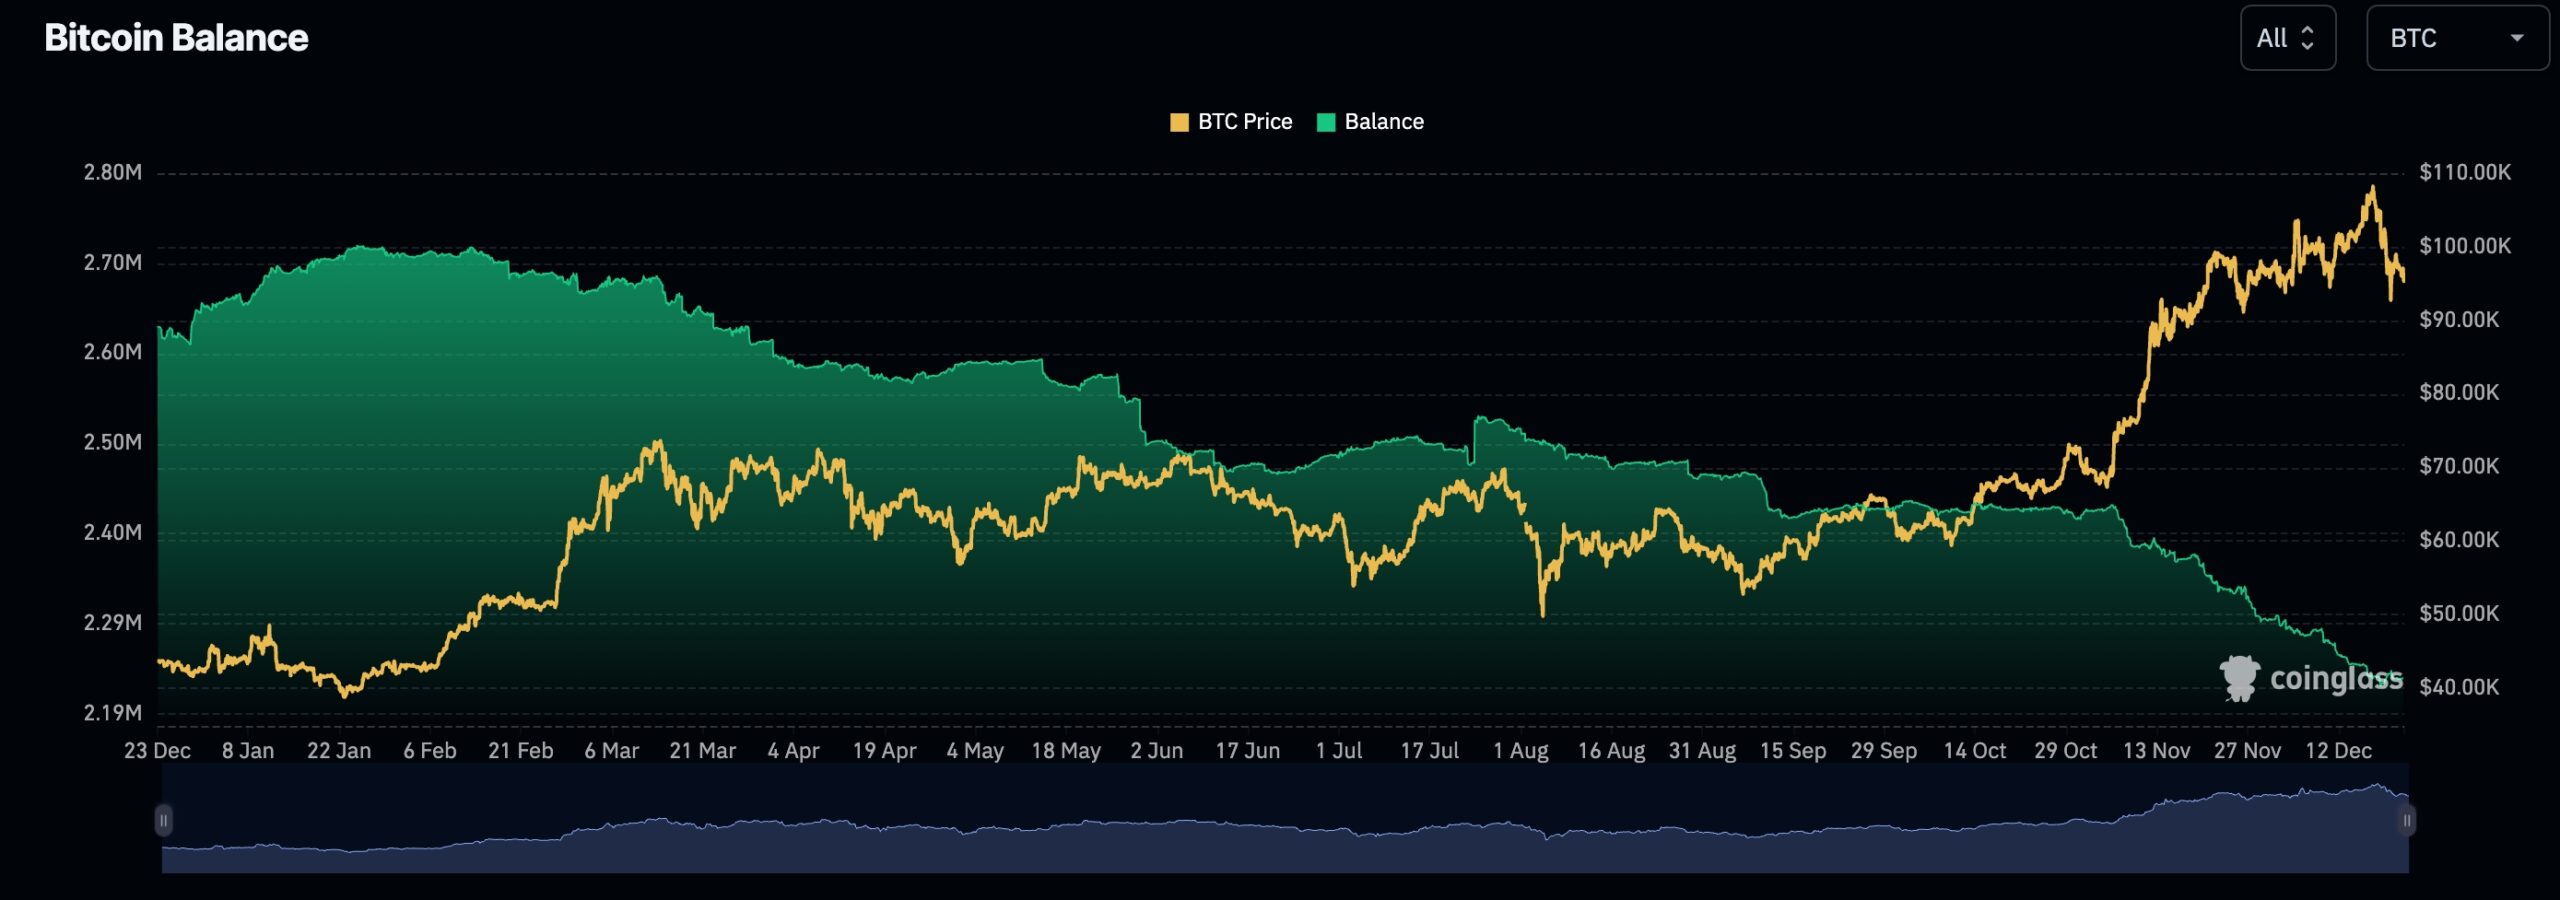
The other important chart predicts that Bitcoin price will recover because demand remains elevated. Most of this demand is coming from companies like MicroStrategy, Marathon Digital, and Hut 8 Mining. Spot Bitcoin ETFs have also continued to accumulate Bitcoins, a move that has pushed their total holdings to over $110 billion.
This buying has pushed Bitcoin exchange holdings to a multi-year low of 2.24 million. There were over 2.7 million coins in exchanges a few months ago. Falling BTC coins in exchanges is good as demand among institutions and long-term holders is rising.
3. Bitcoin inflation is falling
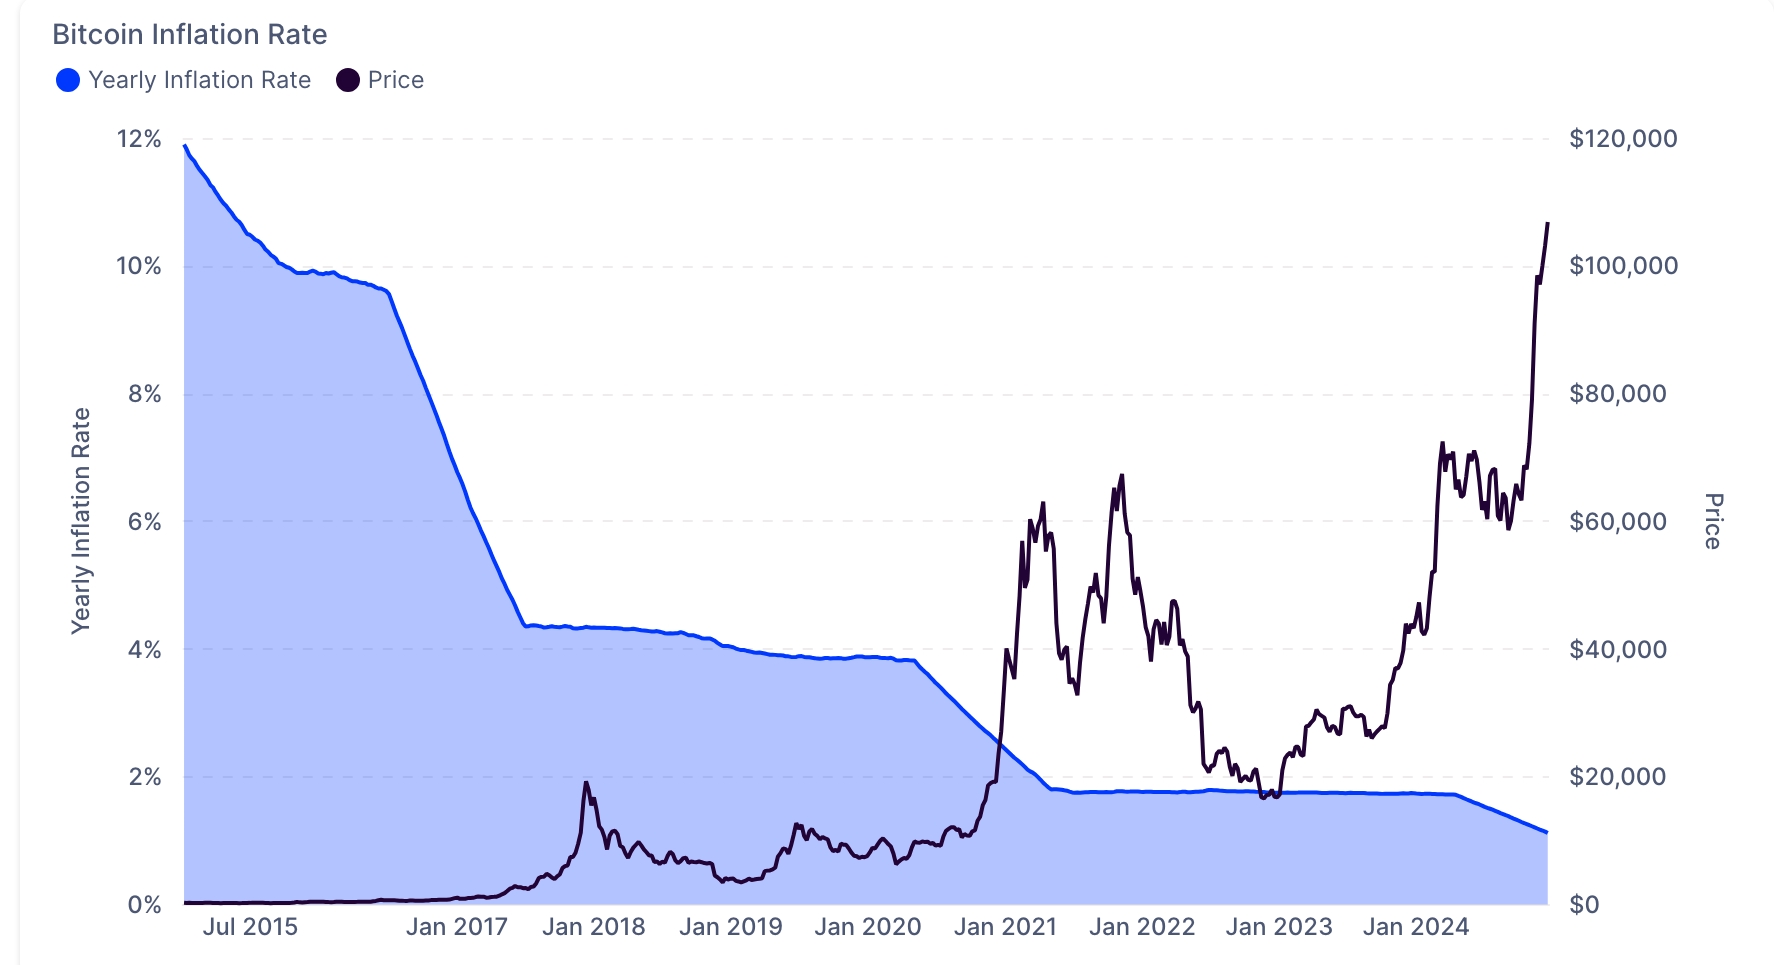
One thing that distinguishes Bitcoin from fiat currencies like the US dollar is its supply cap of 21 million. The US dollar has unlimited supply since the Fed can print as much of it as it needs. Bitcoin’s circulating supply has moved to 19.79 million, meaning miners have just 1.2 million coins left to mine.
Bitcoin’s software has introduced mechanisms to reduce the number of coins mined over time. It has a halving event that happens every four years that pushes mining difficulty higher. The implication of all this is that Bitcoin’s annual inflation rate has tumbled to 1.13%, down from 12% in 2015. This falling inflation trend will likely continue in the foreseeable future.
On the flip side, data from the Federal Reserve shows that the M2 money supply figure has surged and is nearing its all-time high. This explains why the US is struggling to beat inflation.
4. Bitcoin miner reserves are falling
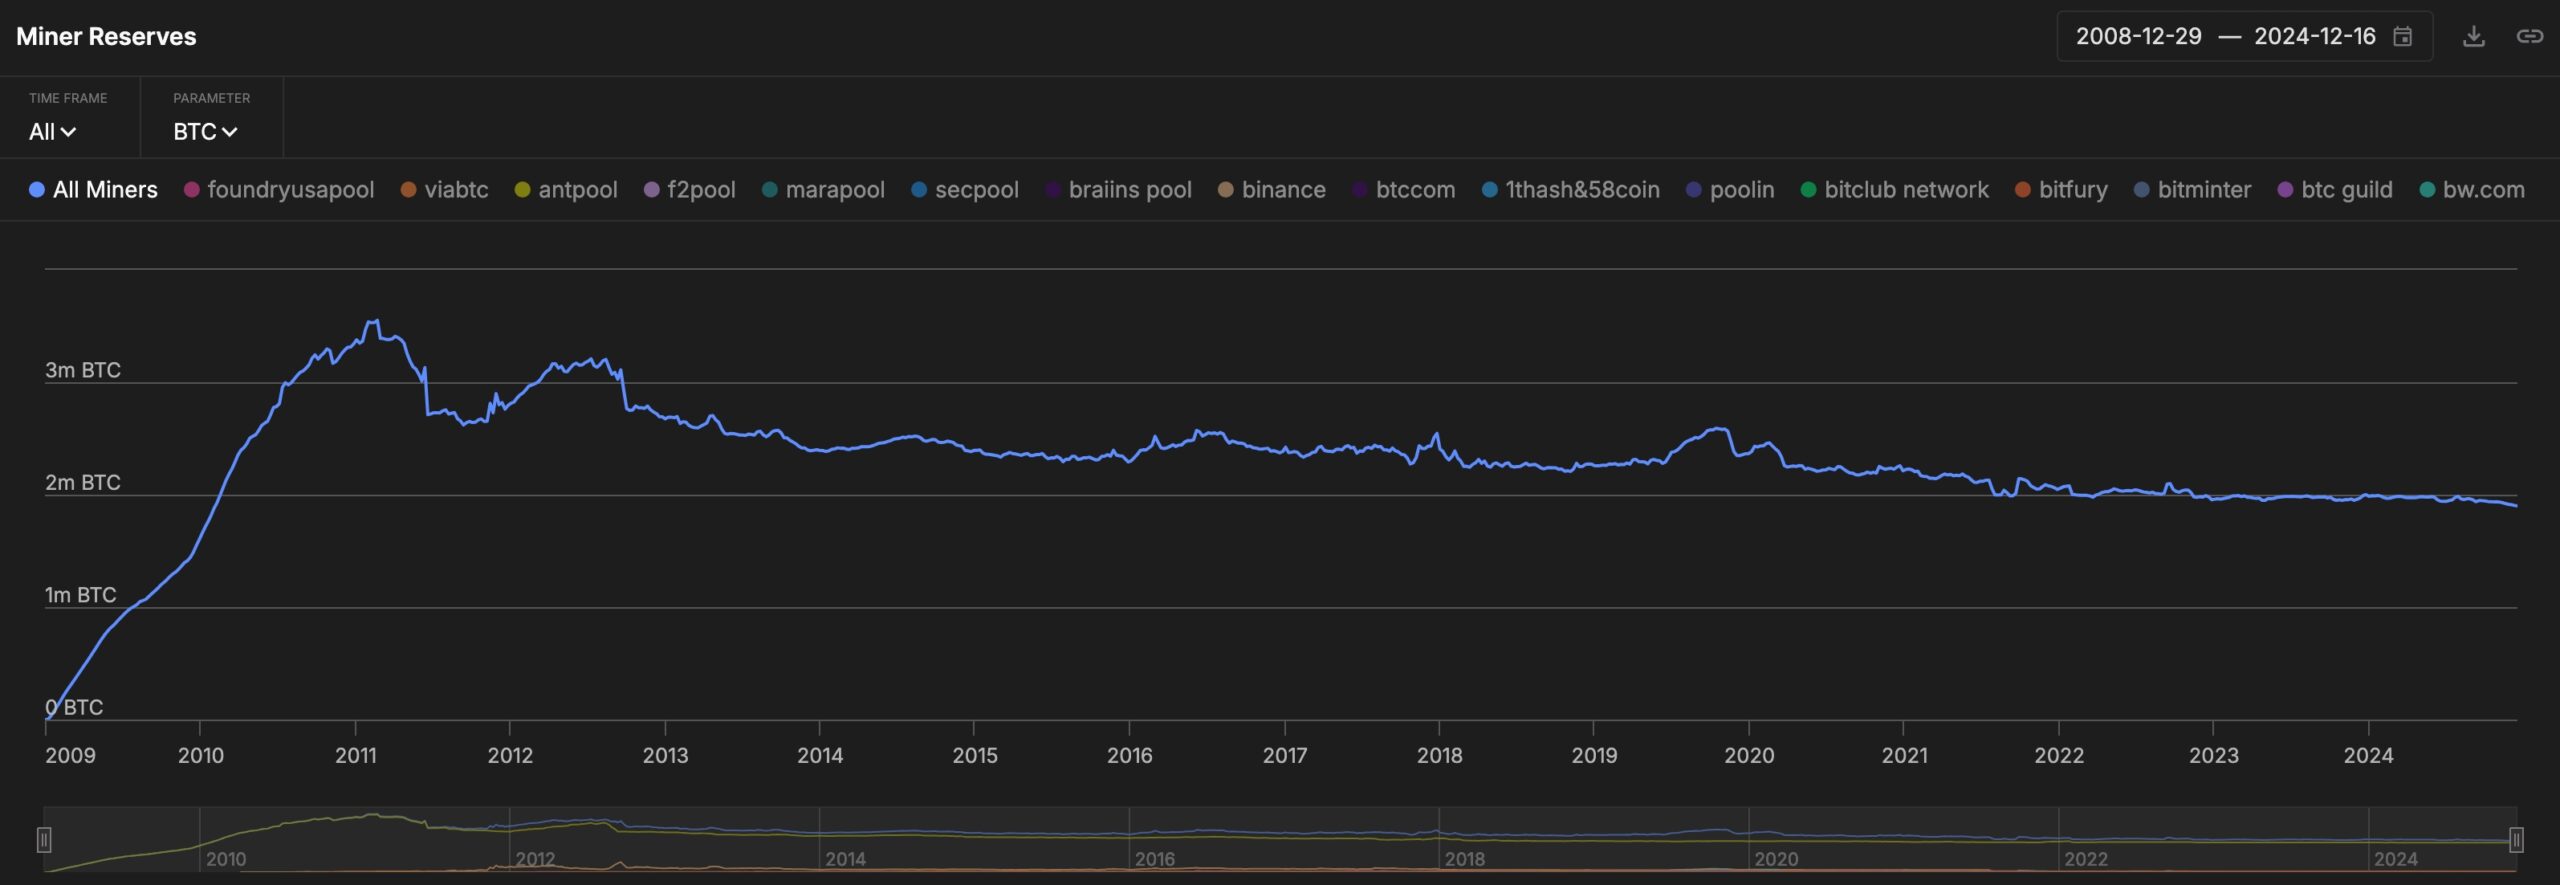
Meanwhile, Bitcoin miners are holding a few Bitcoins in their pools. Data by IntoTheBlock shows that miners hold about 1.9 million coins, the lowest level since 2010. Ideally, miner capitulation should be a negative thing for Bitcoin prices as it increases coins in circulation.
However, recent data shows that the falling miner reserves have happened as Bitcoin prices continue rising. That is because the elevated demand for Bitcoin has helped to offset this capitulation.
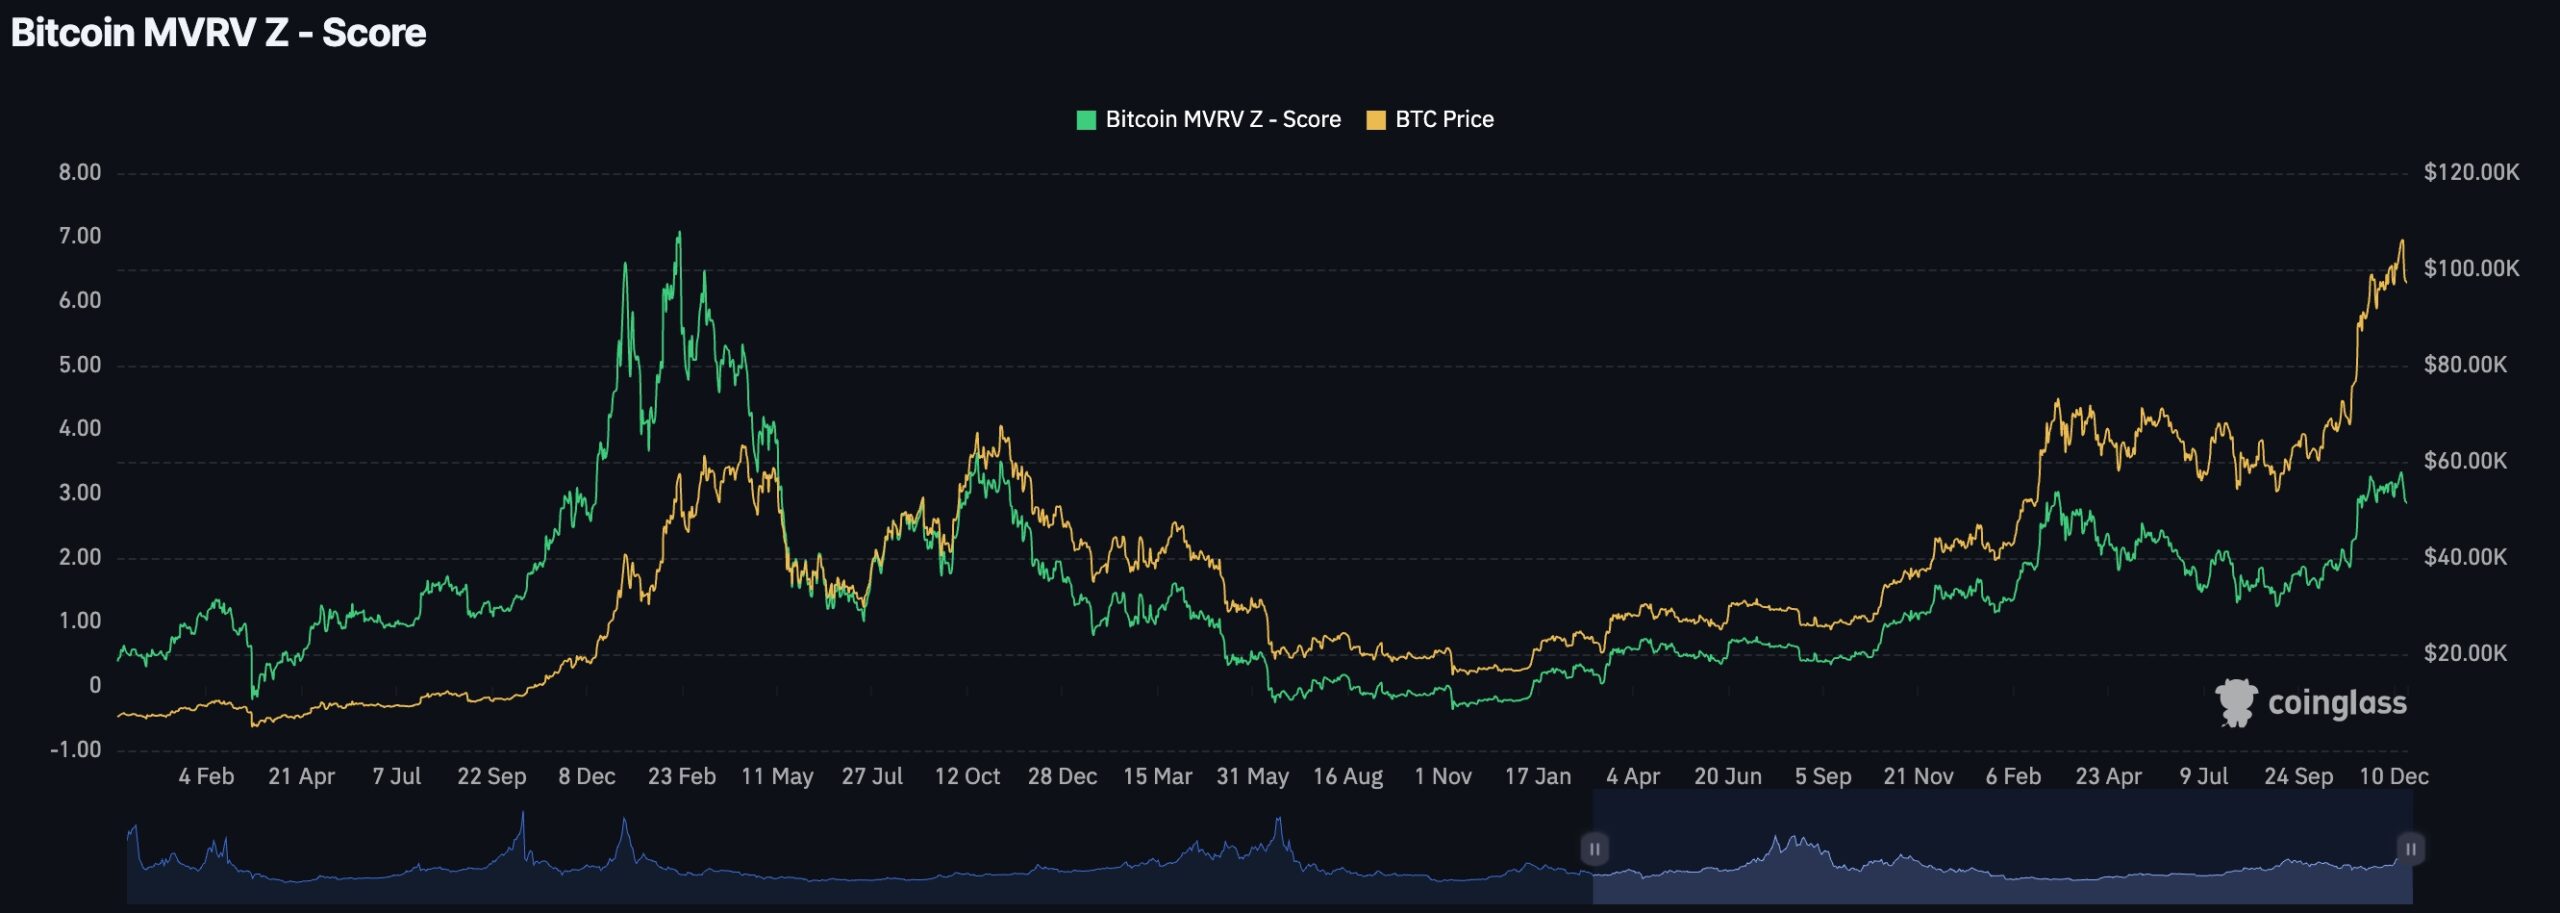
5. Bitcoin MVRV-Z score
Bitcoin’s market value to relative value score (MVRV) also shows signs that the rally has more room to run. As shown below, the score has dropped to 2.86, much lower than 3.7, where it is usually said to be overbought.
Other charts make the case for Bitcoin prices. For example, Bitcoin’s hash rate has surged to a record high, a sign that the network has become healthier. Also, the in-the-money and out-of-the-money chart shows that most Bitcoin investors are now profitable and are likely to continue holding their coins.


